Device lists
Find, filter, and act on a site's switches, ReadyLink clients, access points, smart plugs, UPSes, and IoT devices from the Devices pages.
The Devices group in a site's left rail lists every device on the site, one page per kind of device. Use these pages to check status at a glance, filter down to the devices you care about, change several devices at once, and open any device's panel.
#Open a device list
Inside a site, hover or click Devices in the left rail. Each page shows a count next to its name.
| Rail item | Page title | What it lists |
|---|---|---|
| Firewalls | — | ReadyWall firewalls. See Firewalls. |
| Switches | Switches | Switches, with the ReadyLink clients connected to each one |
| Wireless | Access Points | Access points |
| Power Management | Smart Plugs | Smart plugs and UPSes, in one table |
| IoT Devices | Connected Devices | Phones, cameras, IoT devices, and other devices seen on the site's network |
Every list has a filter panel on the left and a table on the right. Click any row to open that device's panel. See Switch, access point, and client details.
#What each status means
| Status | Meaning |
|---|---|
| Online | The device is connected and reporting to ReadyView. |
| Offline | The device isn't reachable. |
| Dormant | Offline for 7 days or more, or since an unknown time. The site card doesn't count dormant devices as offline, but the Offline filter still lists them. |
| Adopted | An offline device someone acknowledged with Status > Acknowledge (see Act on several devices). |
#Switches
The Switches page lists the site's switches and, under each one, the ReadyLink clients and switches connected to it.
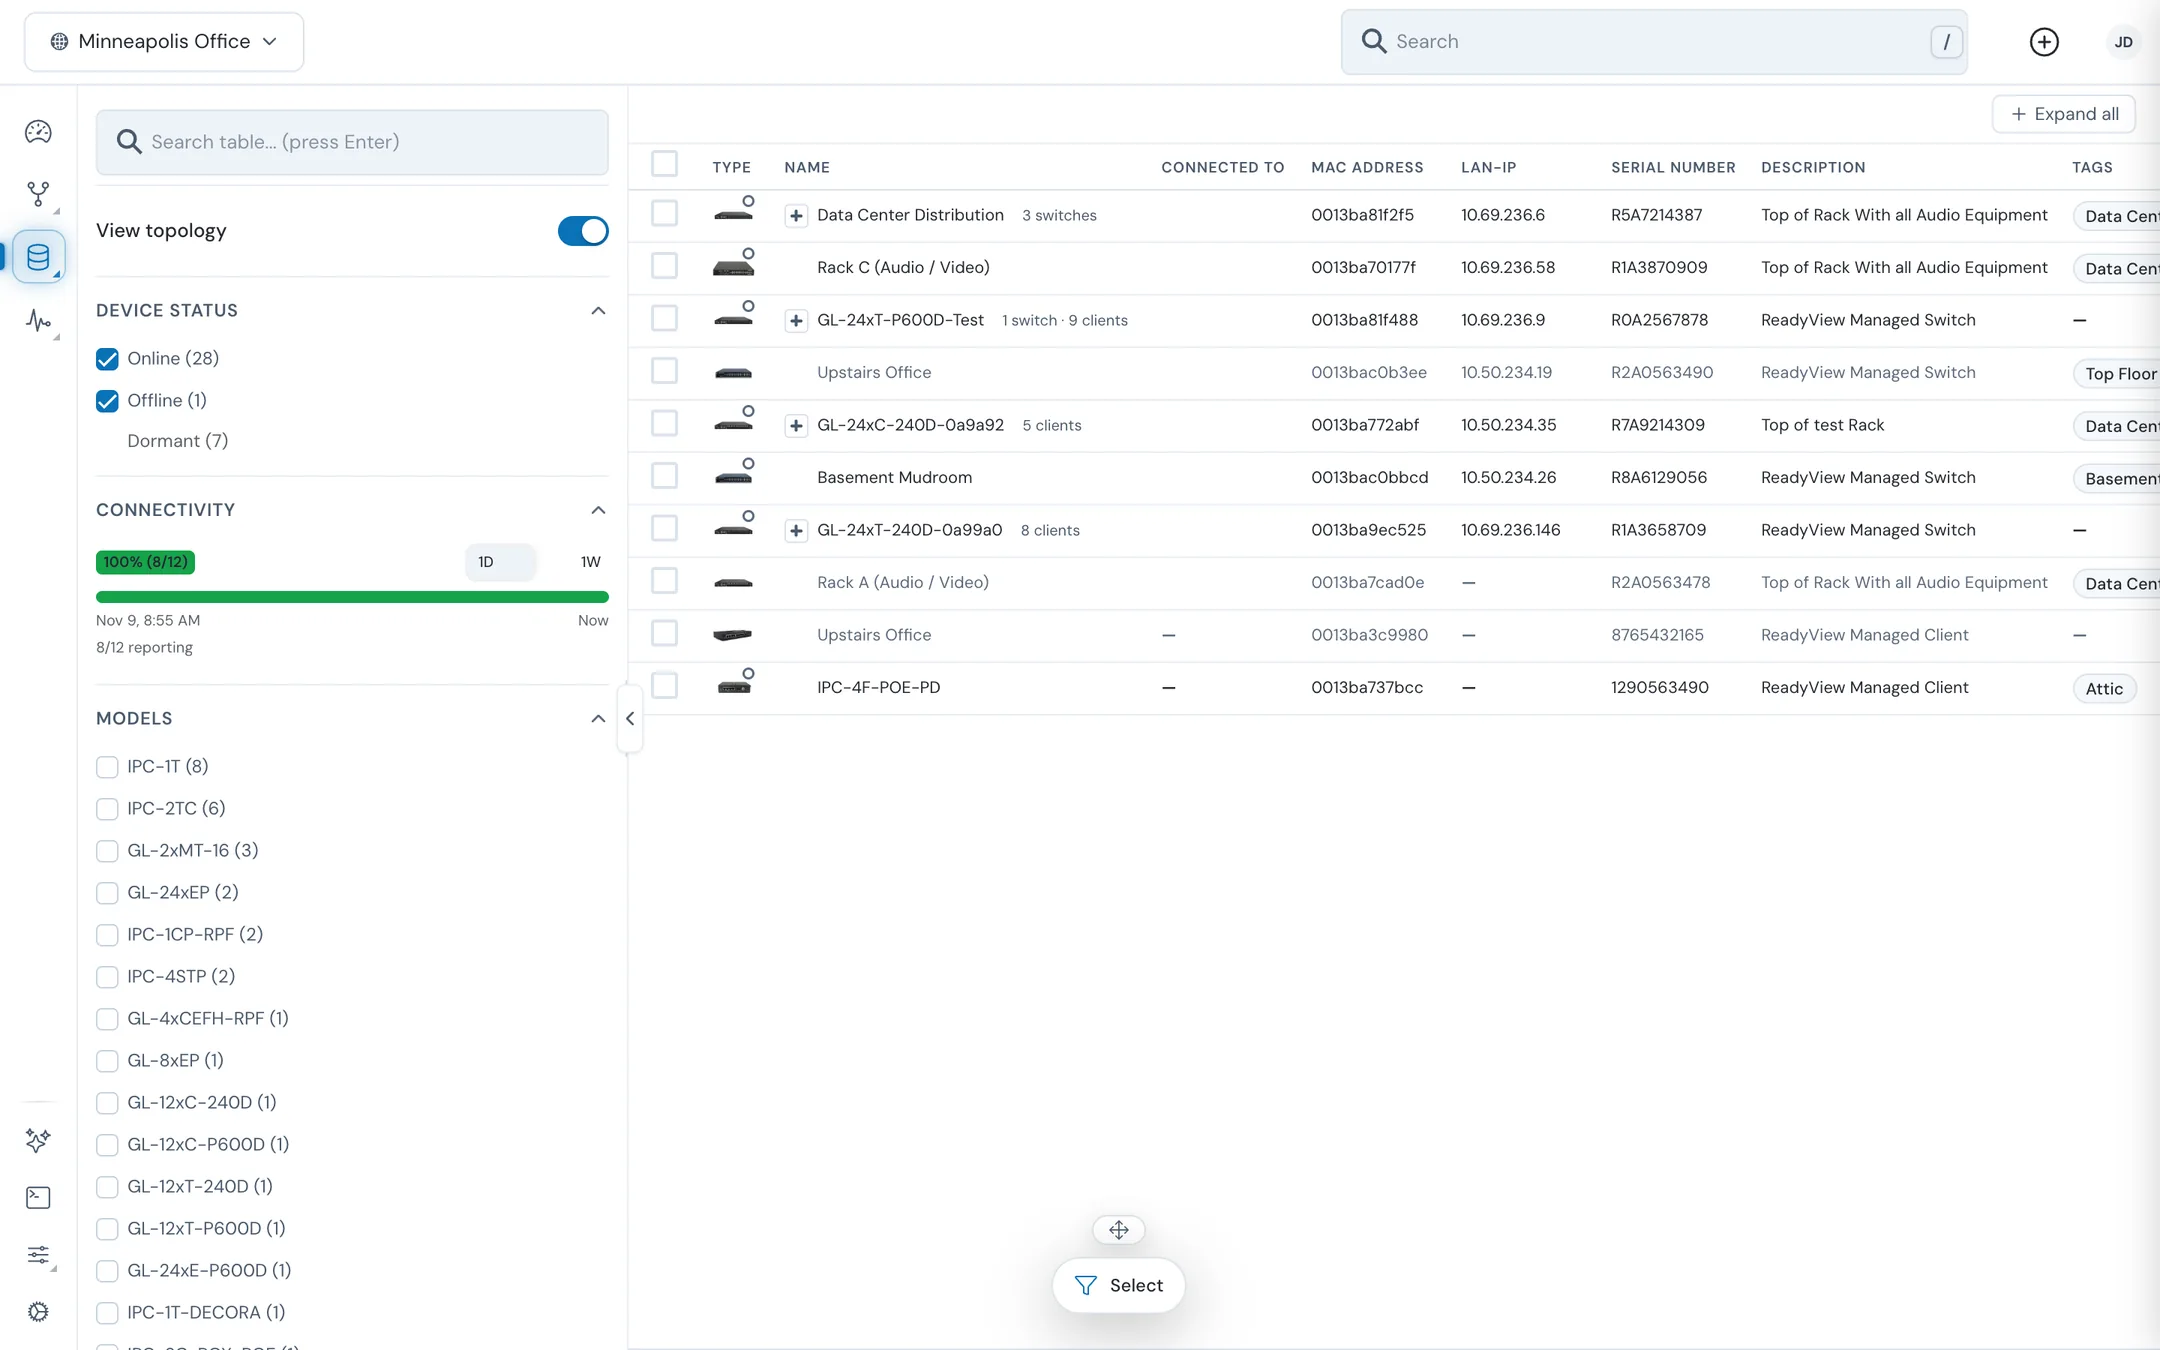
#Use the filter panel
| Control | What it does |
|---|---|
| Search table... (press Enter) | Searches the table. Press Enter to apply. |
| View topology | On: each switch is listed with the clients and switches under it. Off: one flat list of every switch, then every client. ReadyView remembers this choice in your browser. |
| Device status | Online and Offline checkboxes. Dormant shows how many devices are dormant; hover it for the definition. |
| Connectivity | A bar showing how much of the site was online over 1D or 1W. See Read the Connectivity bar. |
| Models | One checkbox per model, with a count. When you tick models, the table shows only those models (and the switches above them). |
| Tags | Filter by tag. See Filter by tag. |
| Visible Columns | Choose which columns the table shows. |
| Export Data | Export to Excel downloads the table. |
#See the clients under each switch
With View topology on:
- Click the + at the start of a switch row to show or hide what's connected to it.
- Or click Expand all at the top right of the table to open every switch at once. Click Collapse all to close them.
A grey switch row is listed only because clients under it match your filters. A row that ends in Redundant link: ... (blocked) is a second path that spanning tree is blocking. Clients that ReadyView can't place under a switch are grouped under Unassigned clients.
With View topology off, the table loads every client after the switches and shows Loading clients… with progress while it does.
#Read the Connectivity bar
The bar is split into 5-minute slots. A slot is green when every reporting device was online and red when one or more went offline. Hover a red stretch to see what happened.
The badge above the bar shows the percentage online and how many devices are reporting, for example 95% (19/20). Only devices with recorded history count toward it, and only devices with MQTT turned on report. The badge is green at 99% or higher, amber from 90%, and red below that.
#Filter by tag
Under Tags, tick one or more tags to show only devices with them.
- New tag creates a tag. Use
/in the name to nest tags, for exampleBuilding/Floor 2. - Add sub-tag adds a tag nested under another.
- Configure next to a tag edits it.
- With more than one tag ticked, choose Any (devices with any of the tags) or All (only devices with every tag).
You can drag tags to reorder them.
#Switch columns
Turn columns on and off under Visible Columns.
| Area | Columns |
|---|---|
| Identity | Type, Name, Mac Address, Serial Number, Description, Tags, Location, Room, Model, ID, Created, Modified |
| Health | Status, Offline Since, Uptime, Connectivity, Temperature, CPU Utilization, Memory Usage |
| Network | Connected To, LAN-IP, Ports, System ID, DHCP Snooping, IGMP Snooping, LLDP, VectorBoost, Mode |
| Software and configuration | Firmware Version, Hardware Version, Kernel Version, Bootloader Version, Configuration, Configuration Template, Configuration ID |
Configuration shows Up to date, Out of sync, or Pending updates, comparing the switch with its configuration template. See Configuration templates.
#Act on several devices
#Select devices
- Tick the checkbox on each row you want.
- Or select by rule: click the floating Select button (drag it if it's in the way), then:
- Pick a field: Status, Model, Name, MAC address, Firmware, or any visible column.
- Pick equals, contains, or matches, and enter a value. matches takes a wildcard pattern such as
*GL-*. - Click Add rule for more conditions. A device must match every rule.
- Click Select matching.
#Choose an action
With devices selected, the menu offers these groups. You see only the actions your role allows.
| Menu | Action | What it does |
|---|---|---|
| Compare | — | Compares two or more devices of the same type. |
| Status | Alarm | "Mark as offline alerts." |
| Acknowledge | "Adopt offline devices." They then show as Adopted. | |
| Config | Template | Choose a configuration template, then Apply Template. Select every device tagged… selects every device on the site with that tag and the template's model. |
| Tags | Add or Remove a tag on every selected device. | |
| Actions | Reboot, Upgrade, Move to Site, Remove | Runs the action on every selected device. |
Reboot, Upgrade, and Apply Template work on switches only. Clients in the selection are skipped.
#Wireless
The Access Points page lists the site's access points. The filter panel has Device status (including Dormant), Tags, and Visible Columns, and the Select button works the same way as on Switches.
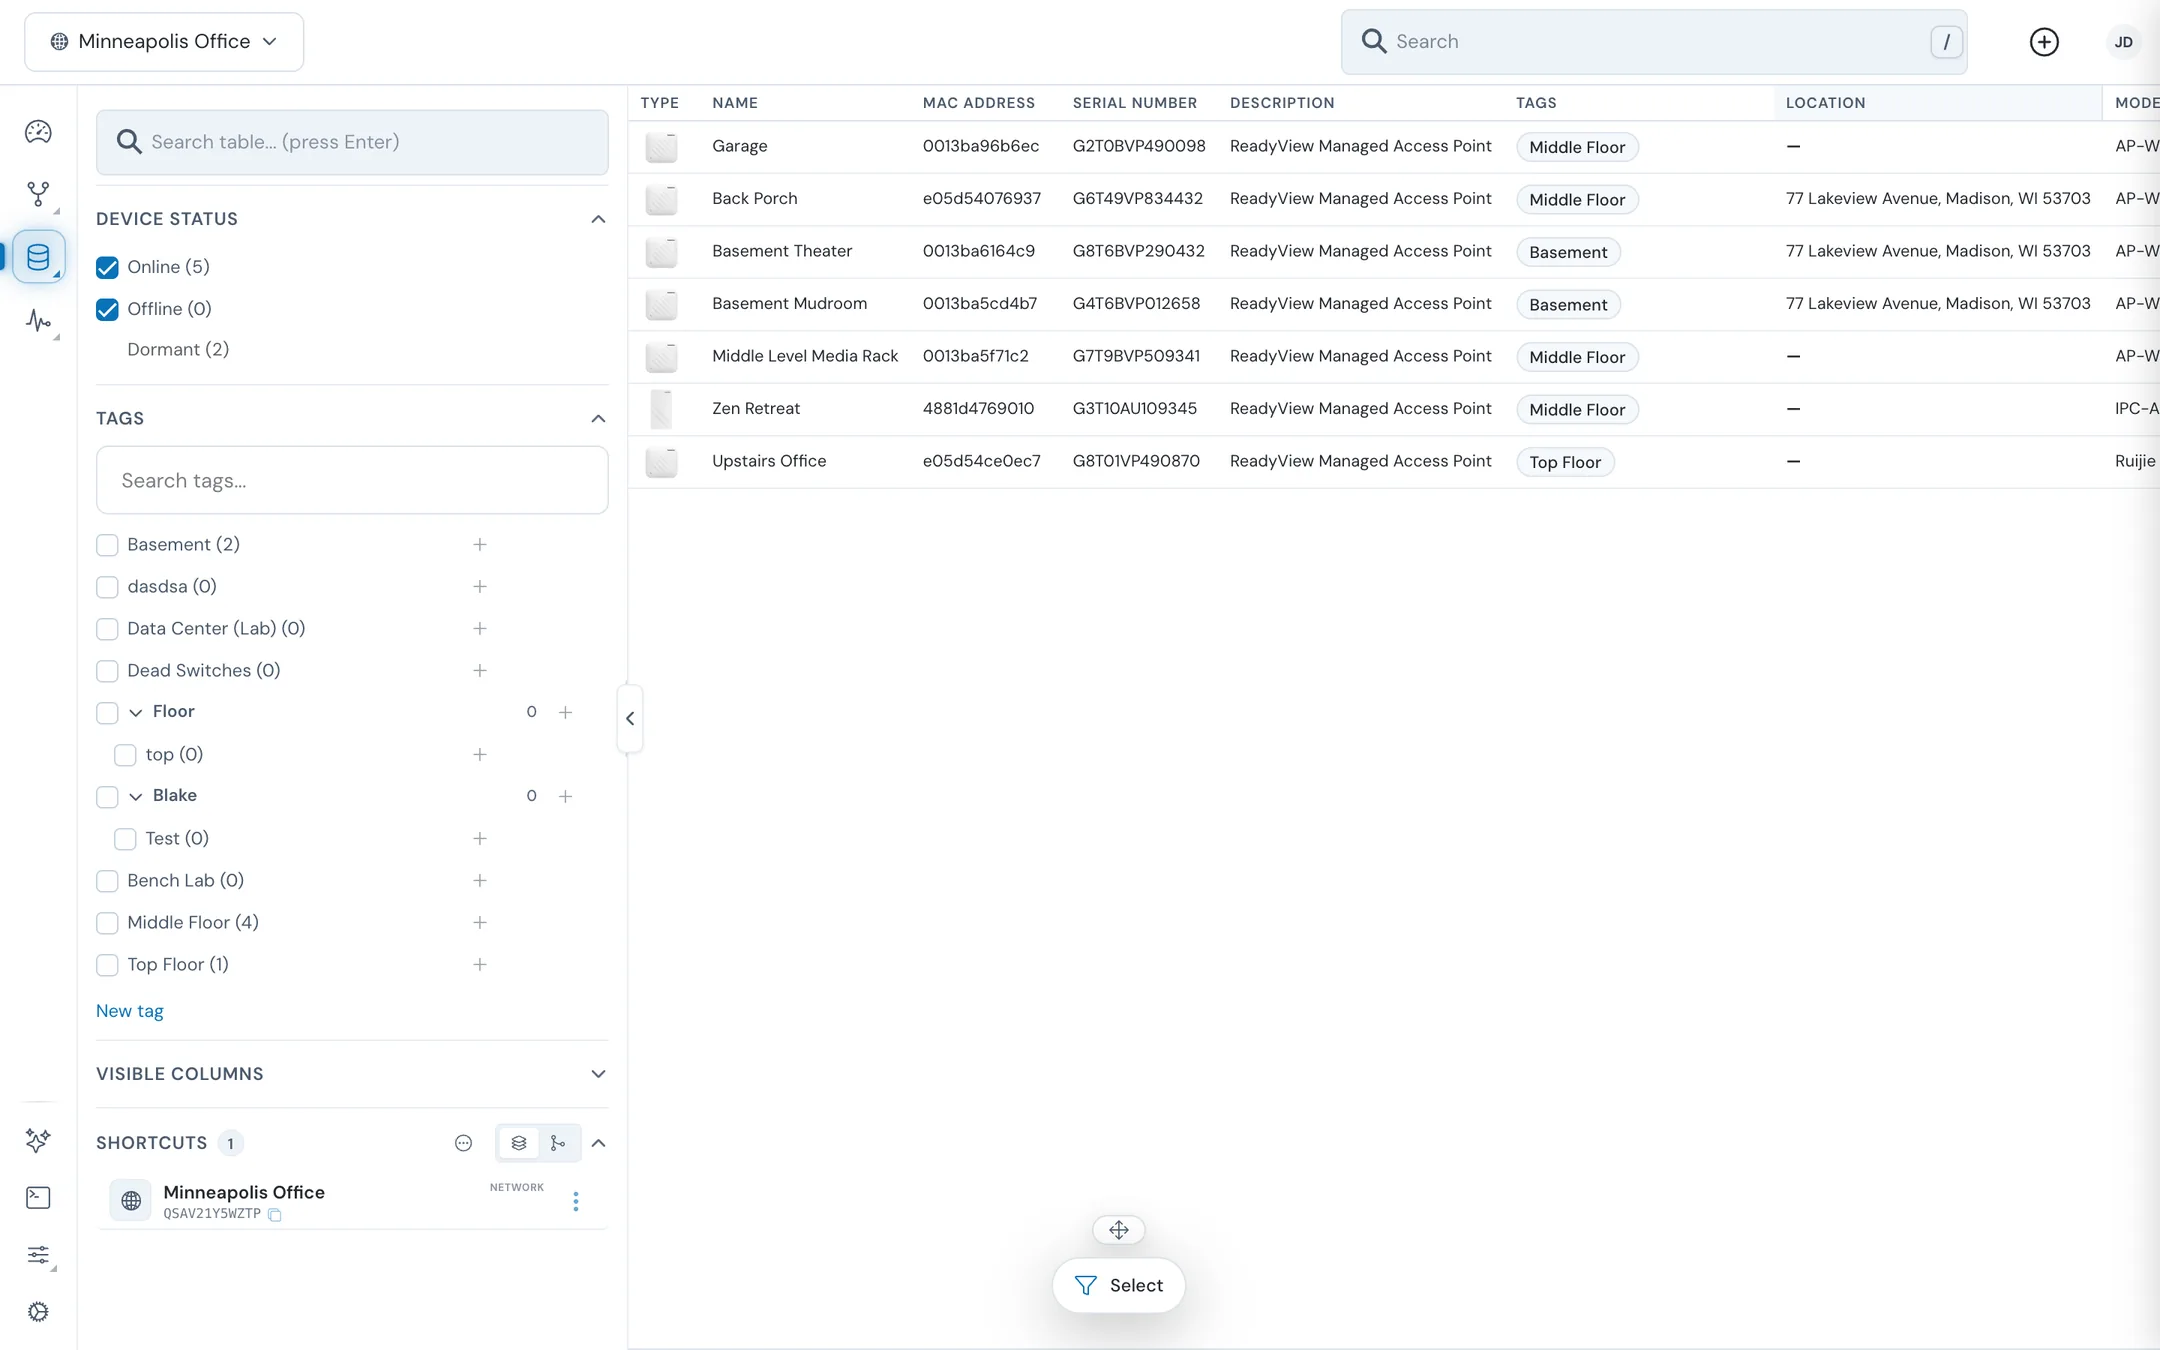
Besides the identity and status columns, the table has per-band columns:
| Columns | Shows |
|---|---|
| Ch. 2.4GHz, Ch. 5GHz, Ch. 6GHz | The channel each radio uses |
| 2.4GHz Clients, 5GHz Clients, 6GHz Clients | Wireless clients on each band |
| WLAN 2.4GHz, WLAN 5GHz, WLAN 6GHz | The wireless networks on each band |
#Power Management
The Smart Plugs page lists smart plugs and UPSes together. Filter by Device status and tags.
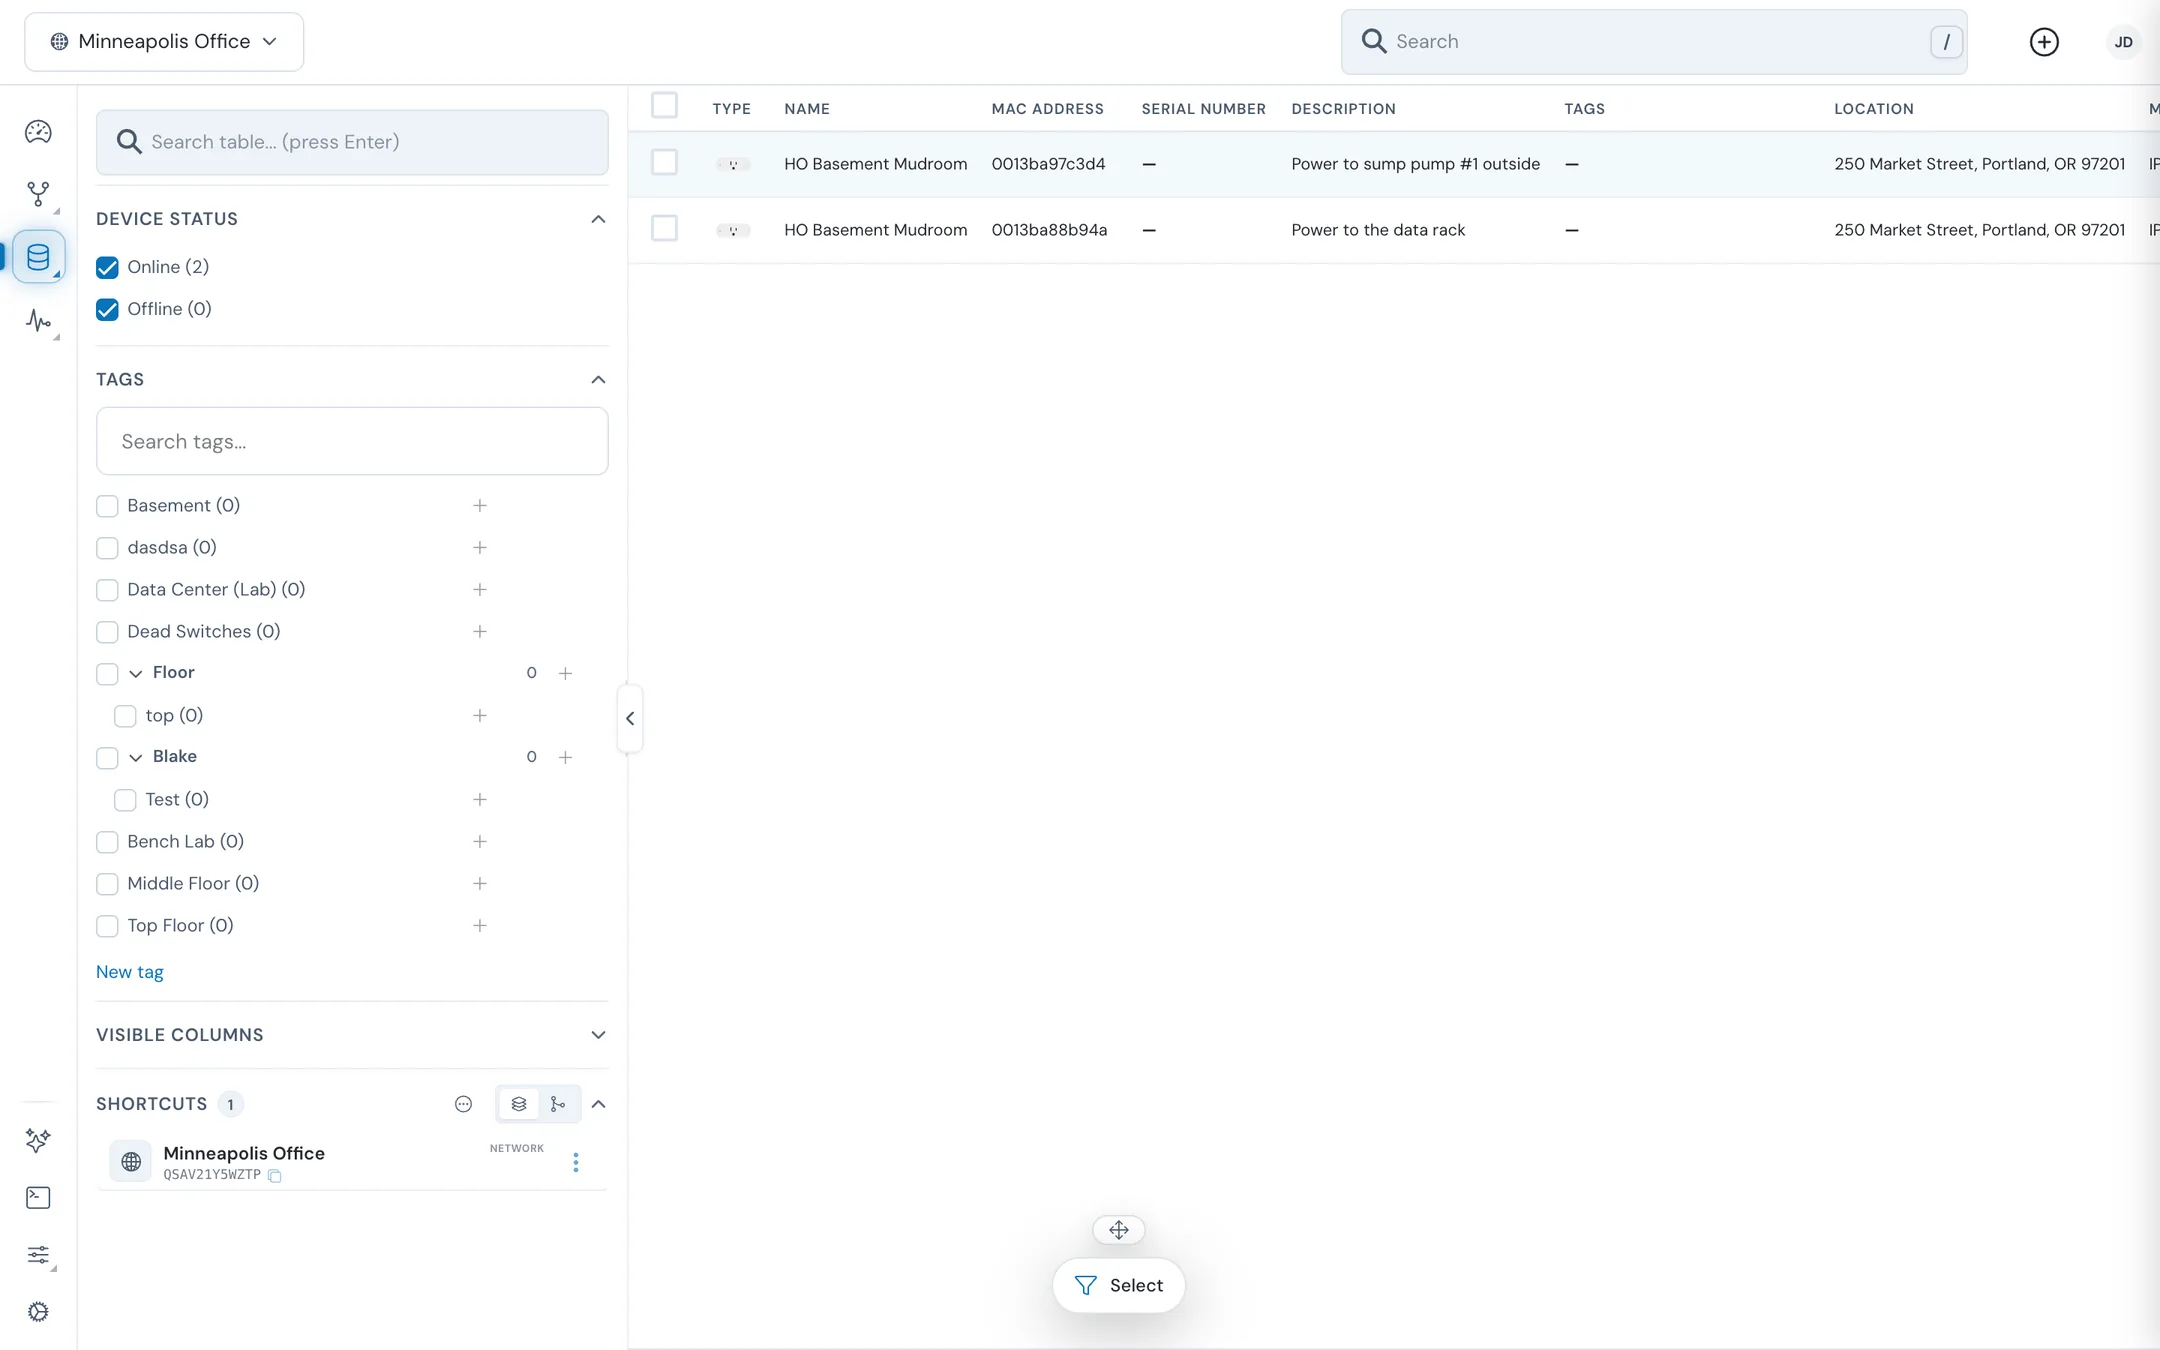
| Column | Shows |
|---|---|
| IP Address | The device's address |
| Current, Voltage, Wattage | Electrical readings |
| Power | Whether the outlet is on or off |
| Battery, Runtime, Load | UPS battery charge, remaining runtime, and load |
#IoT Devices
The Connected Devices page lists the devices ReadyView has seen on the site's network, such as phones, cameras, and IoT devices. The table loads 20 devices per page.
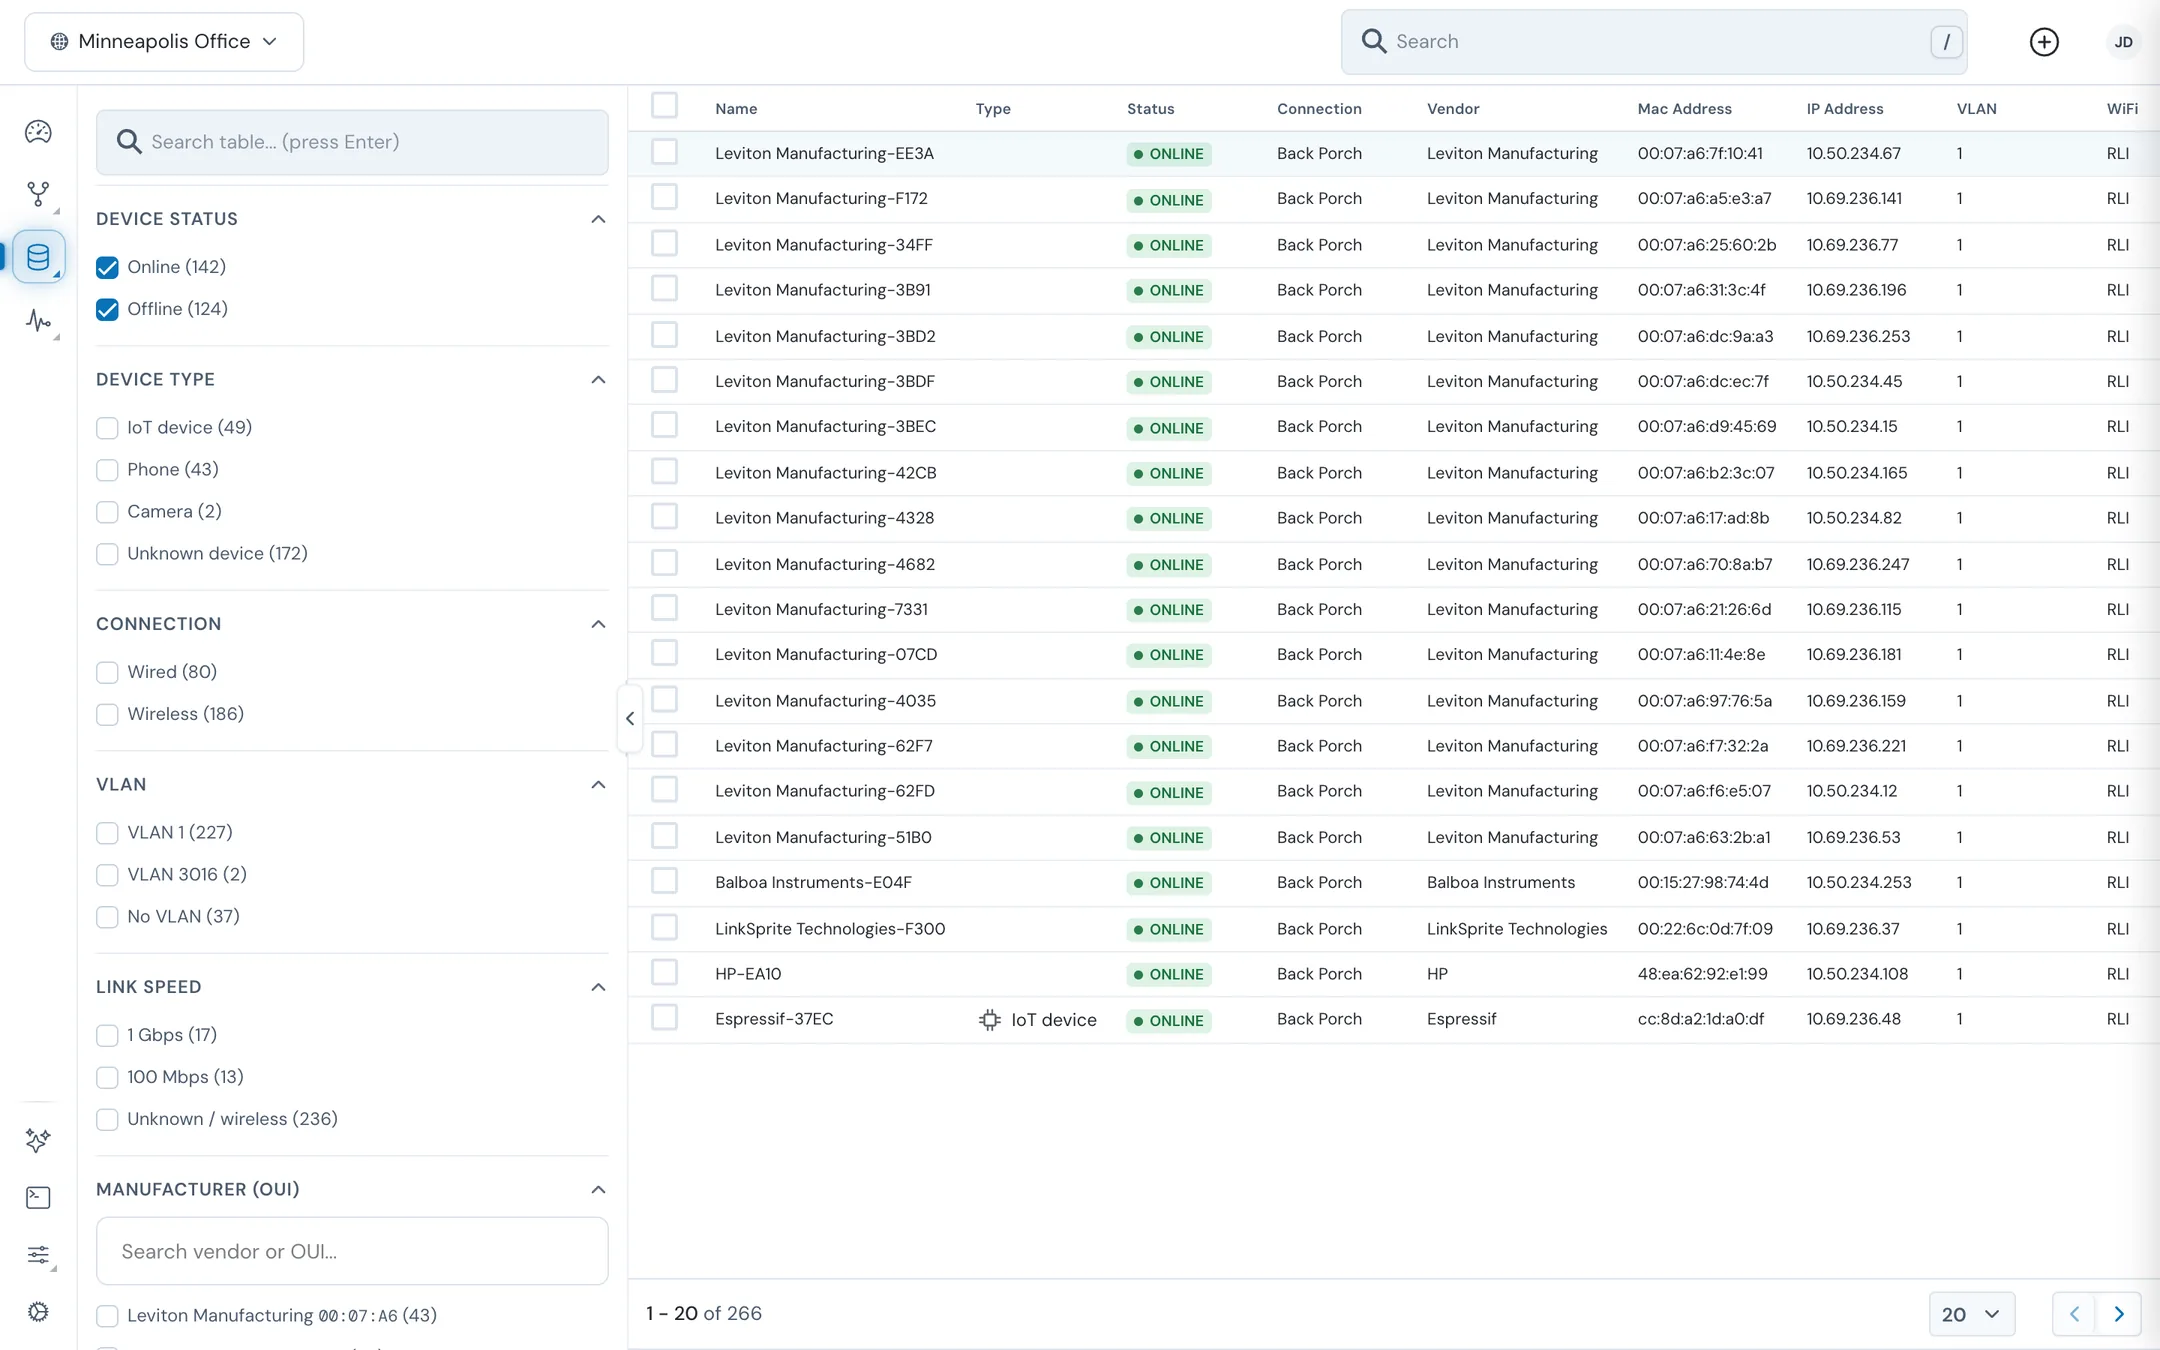
#Filter IoT devices
| Filter | Options |
|---|---|
| Device status | Online, Offline |
| Device Type | Types such as IoT device, Phone, Camera, and Unknown device. Vendor rules you've made are listed under it, scoped to This network or Whole organization. |
| Connection | Wired or Wireless |
| VLAN | Each VLAN, or No VLAN |
| Link speed | The speed of the port the device is on, for example 1 Gbps, or Unknown / wireless |
| Manufacturer (OUI) | Search by vendor or OUI. Includes Private MAC and Unknown vendor. |
| Tags | Your tags |
#IoT columns
Name, Type, Status, Connection, Vendor, Mac Address, IP Address, VLAN, WiFi, Data (24 h), Experience, Last seen, and First seen.
Data (24 h) is the traffic counted on the switch port the device is plugged into. When several devices share that port, the column shows Shared.
To remove devices from the list, tick them and click Remove in the selection bar. A device that's still connected comes back the next time it's seen.
#Related guides
Last updated November 10, 2026