Monitoring
Record a site's IPTV channels and trace each one across the switches, and watch a switch's or client's ports for traffic and data errors.
The Monitoring page helps you find where video and data problems start. IPTV Channels keeps a list of the channels a site delivers and traces any multicast channel hop by hop across the switches. Data Monitoring watches the ports of one switch or client for traffic and errors.
Open a site, then click Monitoring under Operations in the left rail. You can also open it from a switch: on the switch's Insights tab, the Monitoring card has an Open Monitoring button that starts watching every port on that switch.
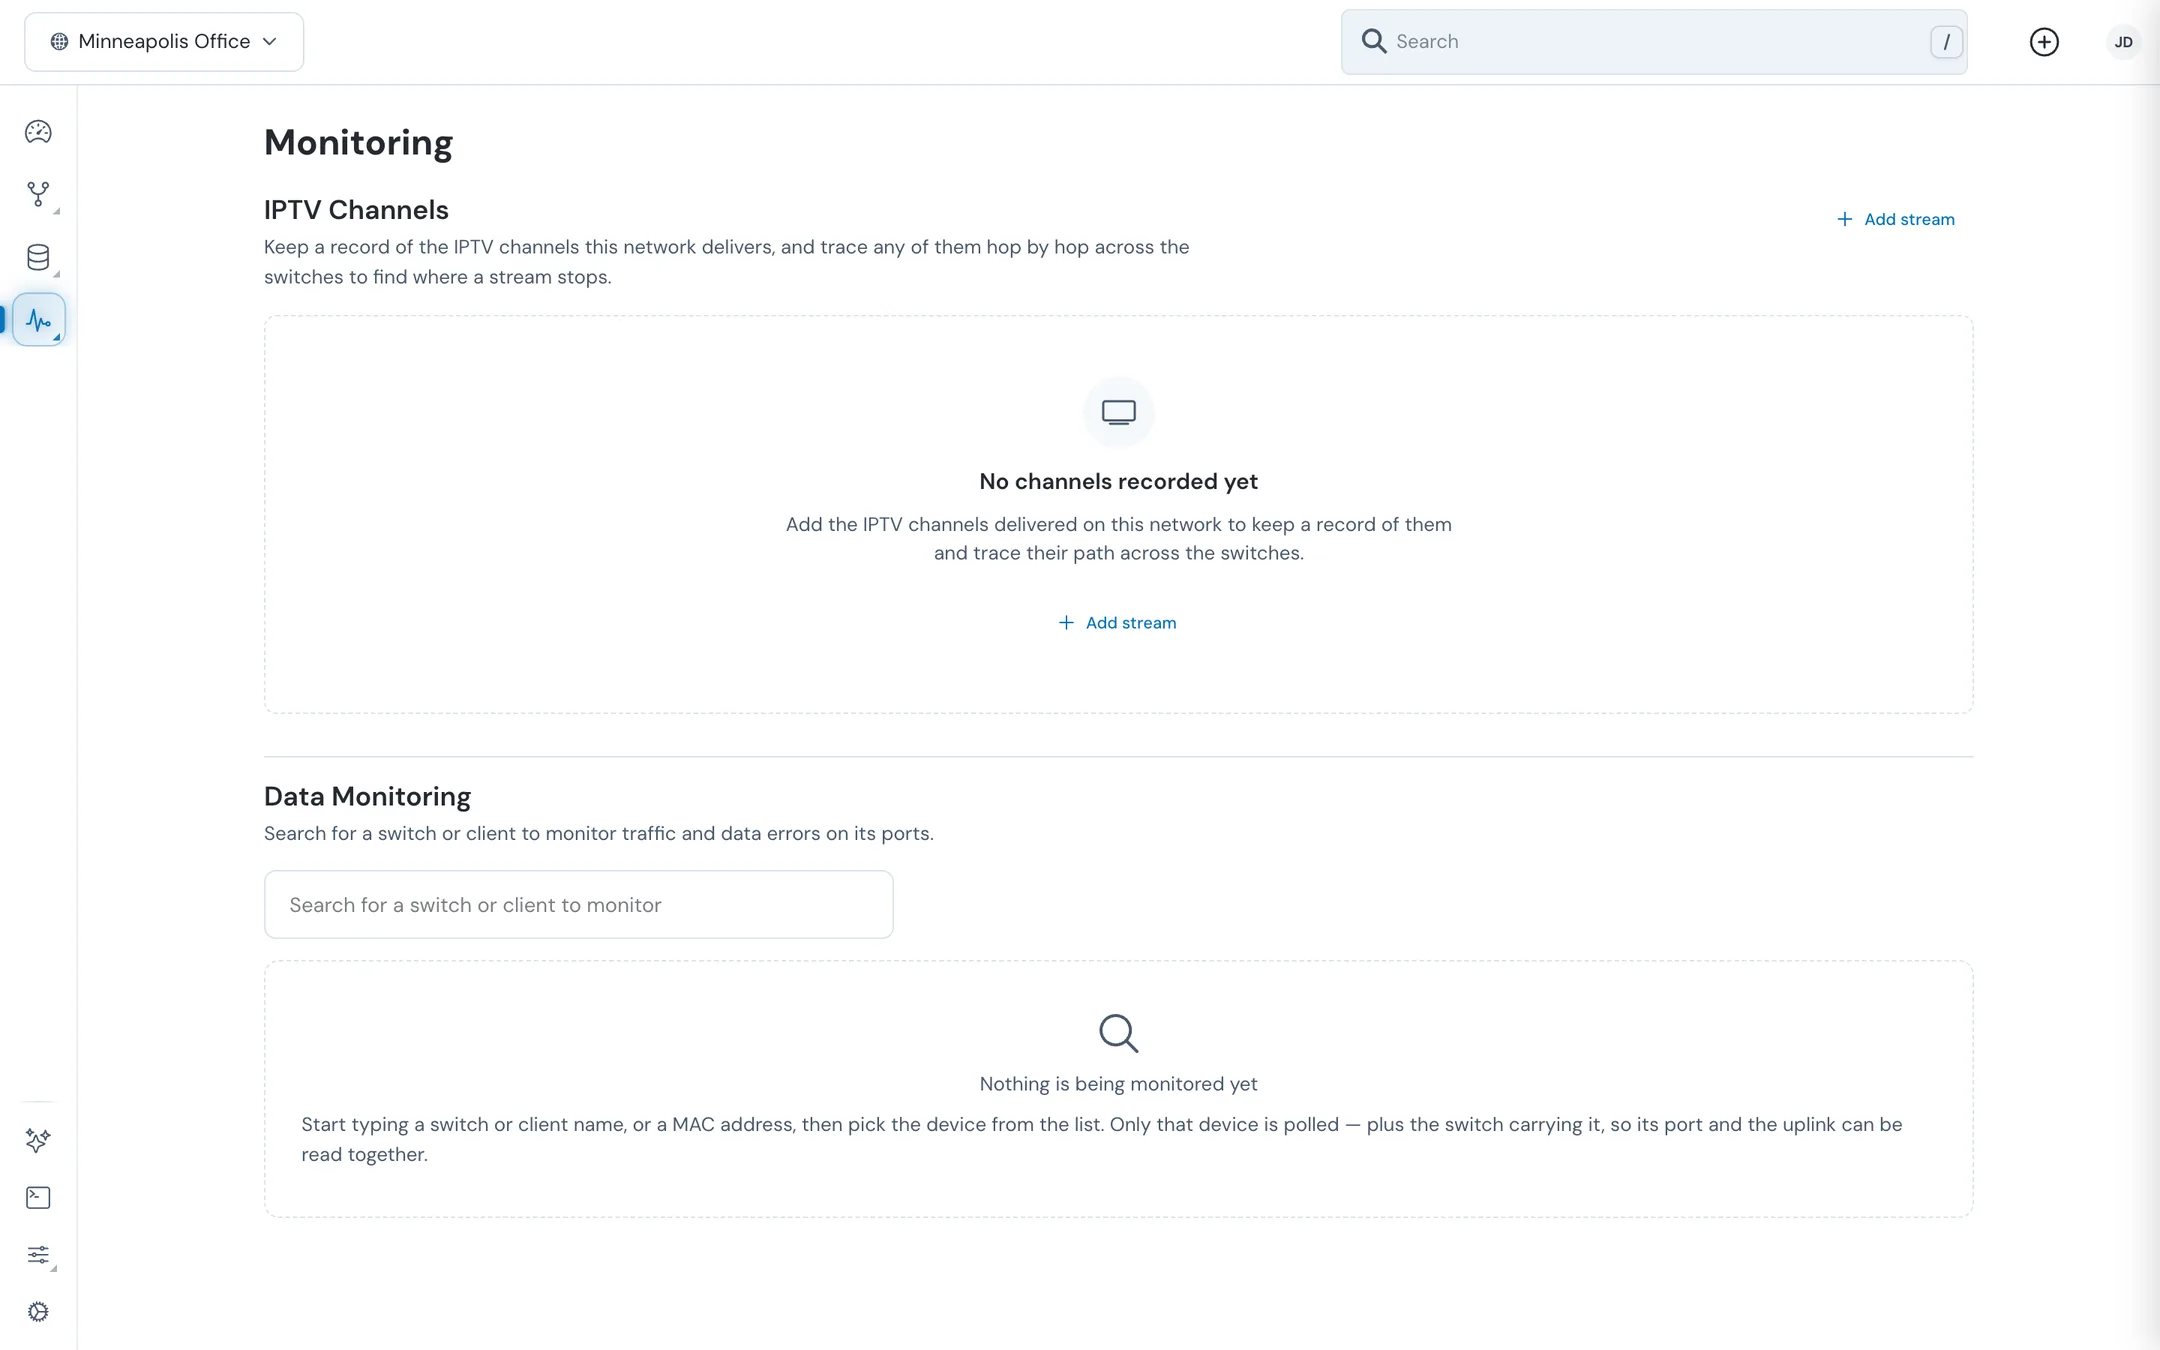
#IPTV Channels
#Add a channel
- Click Add stream.
- Enter a Channel name.
- Enter the Stream address, for example
udp://239.1.1.1:1234. VLC-style addresses with@andrtp://addresses also work. - Click Add.
Adding and editing channels needs permission to update the site. Deleting a channel needs permission to delete sites.
| Address rule | Message if it's wrong |
|---|---|
Starts with udp:// or rtp:// | Only udp:// and rtp:// streams are supported. |
| The host is an IPv4 address | The address must be an IPv4 address, like 239.1.1.1. |
| Includes a port from 1 to 65535 | Include a port between 1 and 65535. |
You can record a unicast address, but ReadyView will tell you it isn't a multicast group address. Only multicast channels can be traced across the switches.
To change a channel, click its pencil icon, edit it, and click Save. To remove it, click its trash icon and confirm Delete stream?.
#Trace a channel
Click the path icon in a channel's Path column to see the path that channel takes. ReadyView reads the IGMP tables of the site's switches and shows every switch that is carrying the channel's multicast group.
The top line says how many of the site's switches carry the group and on which VLAN. It also notes any switches that didn't answer, because their ports aren't covered.
Each switch on the path is listed with its status, its VLAN, and the number of ports that joined the channel. Its table shows those ports:
| Column | What it shows |
|---|---|
| Port | The port name. An uplink tag marks the switch's uplink |
| Role | Transit for a fiber link between switches, where the channel arrives or leaves. Segment for a ReadyLink port that feeds rooms, with how many of its client ports are carrying multicast. Other for any other port |
| State | Healthy, Degraded, Down, Dormant, or Unknown |
| In pkt/s and Out pkt/s | Multicast packets per second in and out of the port |
| Errors | Errors since the last reading. The total since the switch booted is shown in Detail |
| Detail | Any problems: errors, link down, no counter reading, no multicast this interval, or reading not refreshed |
Click a port to see What is passing it: every multicast group the port has joined, with this channel marked. For a Segment port you also see each client port on that ReadyLink segment, with its multicast packet rates, errors, and when the client was last read.
If no switch reports carrying the group, either nobody is watching the channel right now, or the stream address doesn't match the group the head end sends. Switches only list a group while a device is tuned to it.
#Data Monitoring
Data Monitoring watches the ports of one device at a time.
#Watch a device
- Type a switch or client name, or a MAC address such as
00:13:ba:12:34:56, in Search for a switch or client to monitor. - Pick the device from the list. Clients show the switch they're on. Offline devices are marked Offline and can't be monitored.
ReadyView then reads only that device, plus the switch carrying it when you pick a client, so the client's ports and the uplink can be read together. Picking a switch shows its ports and its clients' ports together. The line above the results reads Monitoring device name. Click Stop to stop watching.
#Read the results
The summary line says how many ports were read, on which switches and clients, and how many ports have issues. Notes under it explain readings that can't be trusted yet:
| Note | What it means |
|---|---|
| N awaiting a second reading | A rate needs two readings. "A second reading needs the device to publish again, which takes about 90 seconds" |
| N showing last known reading | The device hasn't reported new counters since that reading |
| N with no traffic | Ports with link that carried nothing. Often normal and never counted as a fault |
| N reporting unusable counters | The device reports values that can't be believed, so nothing is measured from them |
Ports with issues are grouped by device. Each group shows the device's status, whether it's a switch or a client, its model, and its port count. For a client, Switch / port shows where it connects; click it to watch that switch and its clients together.
| Column | What it shows |
|---|---|
| Port | The port name |
| State | The port's status |
| Rx Mb/s and Tx Mb/s | Traffic received and sent |
| Packets rx / tx | Packets received and sent |
| Errors | Errors in the last interval, and the error rate per million frames (for example 12/M). Click the count to see what the errors are made of |
| Detail | The kinds of problem found on the port. Hover over one for an explanation. Switch ports report receive errors only |
#Common issues
| Issue | Usual cause |
|---|---|
| FCS errors | Frames corrupted in transit, usually cabling, a connector, or interference along the run |
| fragment frames | Short frames with a bad checksum: collisions, a duplex mismatch, or bad cabling |
| late collisions | Almost always a duplex mismatch or a cable run that's too long |
| collisions | Normal in small numbers on a half-duplex link; a duplex mismatch when it persists |
| oversize frames | An MTU or jumbo-frame mismatch with whatever is sending |
| jabber frames | A failing transmitter or network card at the far end |
| undersize frames | A sender misbehaving rather than the cable |
| receive errors | Frames the port couldn't receive cleanly. On a switch port this is the only error count the device reports |
| optical level out of range | A fiber module's light level or temperature is outside its rated range. This shows as packet loss and pixelating video before it shows in any error count |
| link down | Nothing is reachable through the port. Check the cable, the far-end device, and its power |
Clicking an error count breaks it down by error kind. On a ReadyLink port it is also broken down by connected client, because the port counts received errors separately for each MAC address on it.
#Related guides
Last updated November 10, 2026