Ports Manager
See every port on a switch or ReadyLink client in one place, filter and export them, look back at past port state with Time Machine, and configure one or many ports at once.
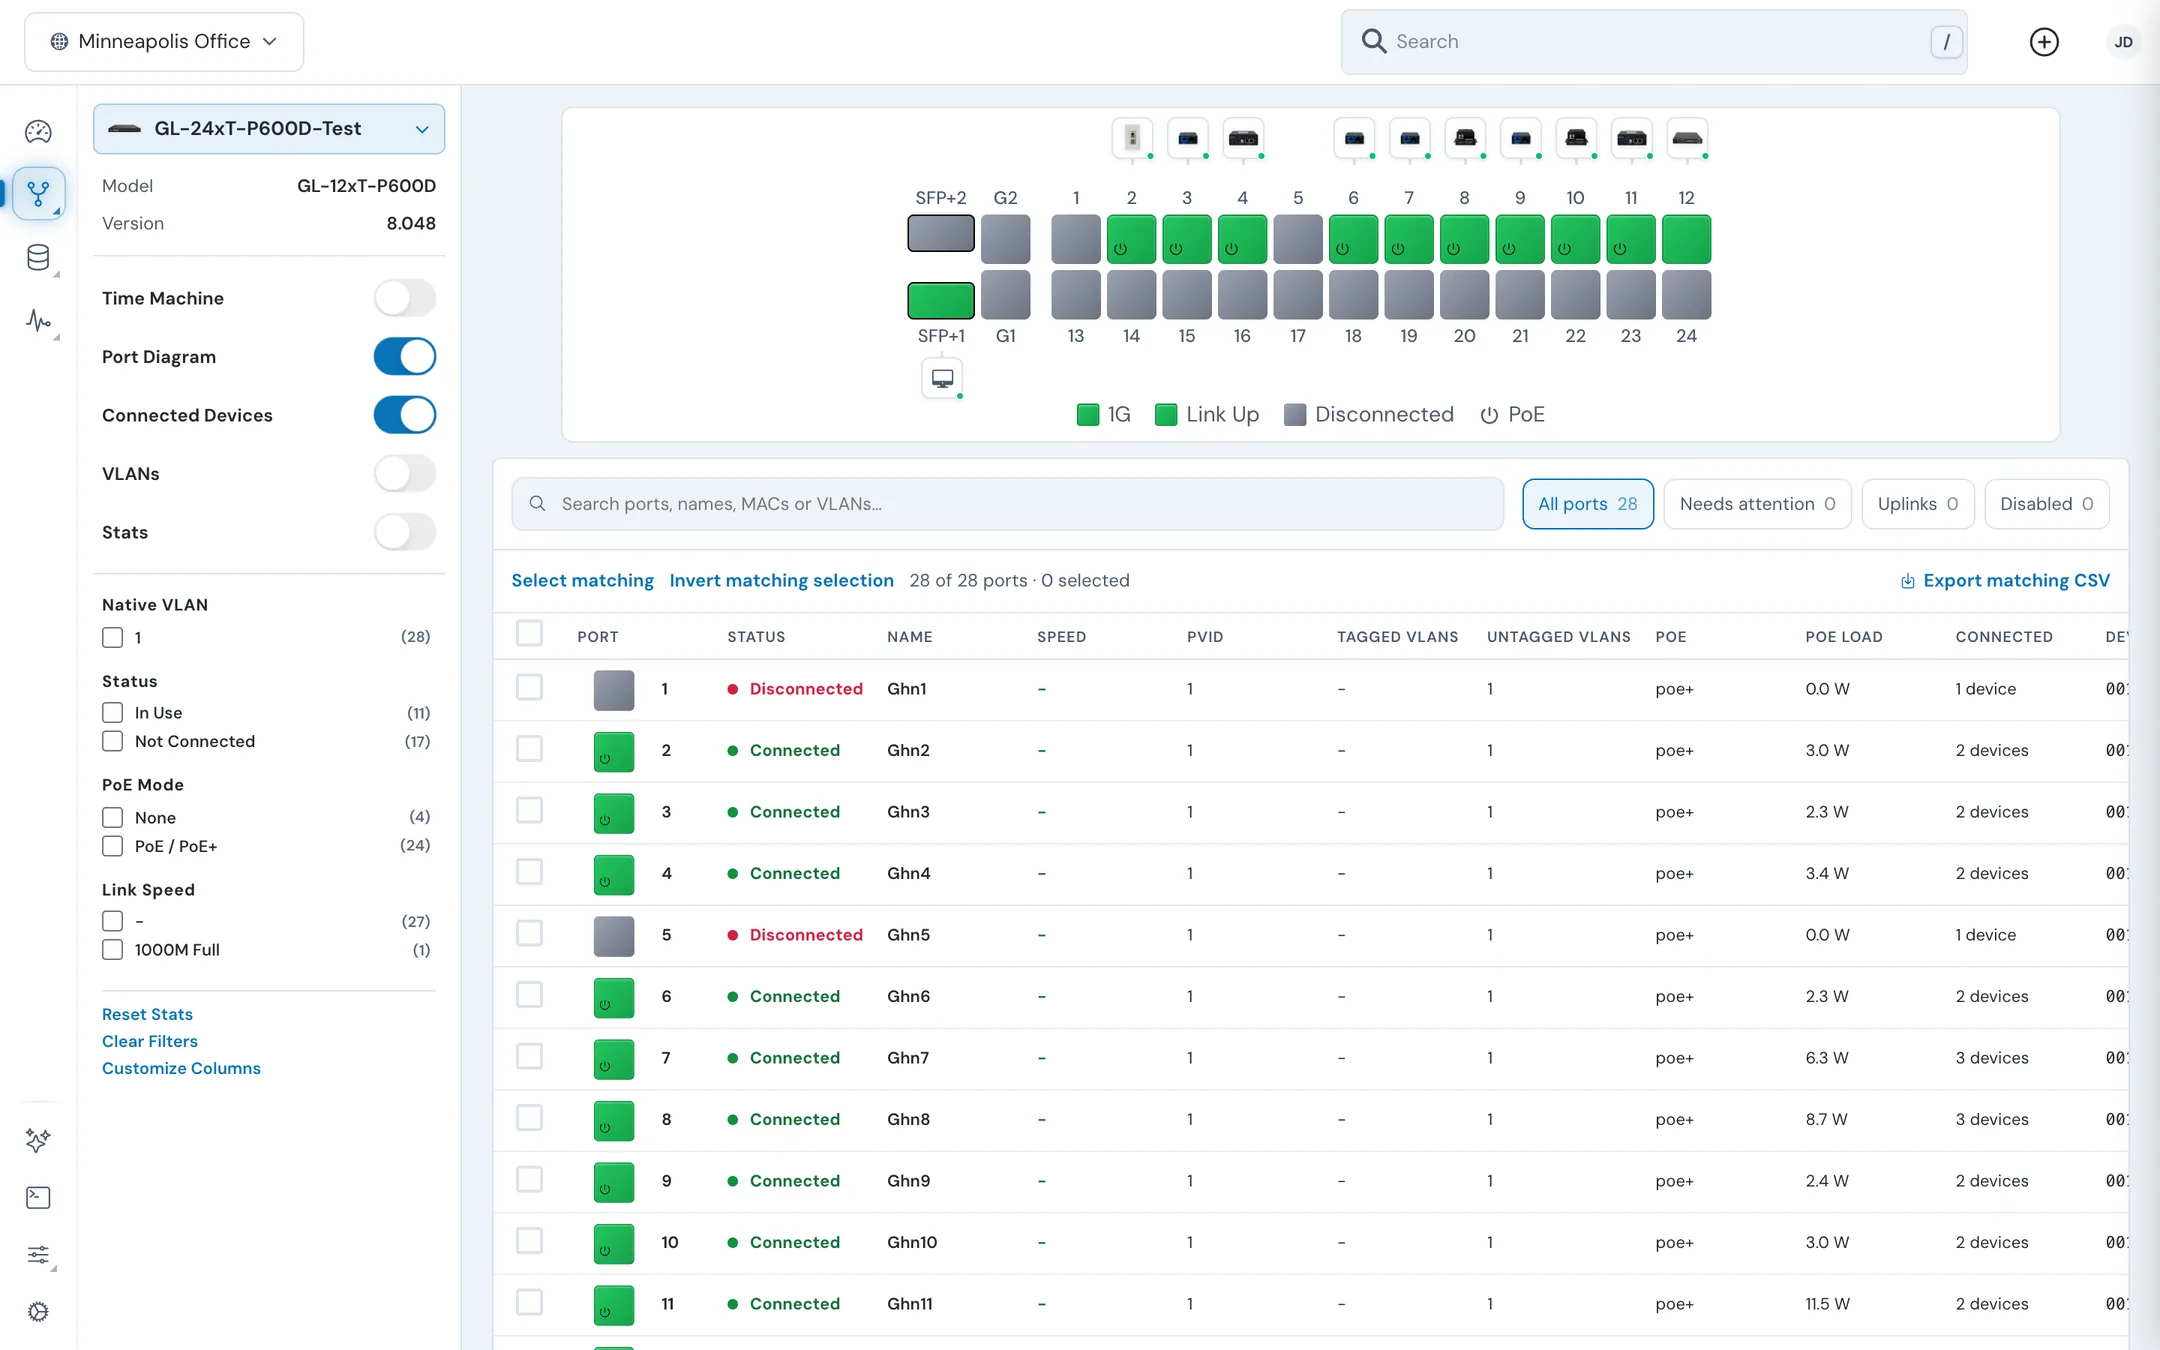
Ports Manager shows every port on one switch or ReadyLink client: a port diagram, what's connected to each port, VLANs, traffic statistics, and a table you can search, filter, export, and configure from. Open it from Network > Ports Manager in a site's left rail, or from the Ports Manager link on a device's Overview tab.
#Choose a device
Use the dropdown at the top of the left panel to pick the switch or ReadyLink client. Search by name, or browse the Devices and Clients lists. Offline devices are marked. The panel shows the device's Model and firmware Version underneath.
#Choose what to show
The toggles in the left panel turn each part of the page on or off.
| Toggle | Shows |
|---|---|
| Time Machine | A timeline for looking at the ports as they were earlier. See Look back with Time Machine. |
| Port Diagram | The device's ports as they appear on the front panel, with a legend for link speed, link up, disconnected, and PoE. |
| Connected Devices | An icon above or below each port for what's plugged into it. Hover an icon for its name, port, MAC Address, and Speed. |
| VLANs | One port diagram per VLAN, showing which ports carry it. |
| Stats | Traffic charts. See Read port statistics. |
When you select a ReadyLink port, the left panel lists the ReadyLink clients on it. The UI titles this list "G.hn endpoints on" followed by the port name.
#Filter the ports
#Filters in the left panel
| Filter | Options |
|---|---|
| Native VLAN | Each PVID on the device |
| Status | In Use, Not Connected |
| PoE Mode | For example None and PoE / PoE+ |
| Link Speed | Each negotiated speed, for example 1000M Full |
Each option shows how many ports match. Below the filters:
- Reset Stats clears all filters and sets the stats time range back to 1D. It only resets what you're viewing; the switch's port counters aren't changed.
- Clear Filters clears the filters.
- Customize Columns chooses the table's columns.
#Quick filters and search
Above the table, the quick filters show a count each:
| Quick filter | Ports shown |
|---|---|
| All ports | Every port |
| Needs attention | Ports with an anomaly, a detected loop, an SFP optics problem, or a powered ReadyLink port with no ReadyLink link |
| Uplinks | Uplink ports |
| Disabled | Ports that are turned off |
The search box (Search ports, names, MACs or VLANs…) matches every word you type:
port 12orport:12finds port 12.vlan 20orpvid 20finds ports with PVID 20.- A plain number matches a port number or a PVID exactly.
- Four or more hex digits match inside a MAC address learned on the port.
- Anything else matches the port's name, description, type, or speed.
The line above the table shows how many ports match and how many are selected, for example 24 of 28 ports · 2 selected.
#The port table
| Column | Shows |
|---|---|
| Port | Port number |
| Status | Connected or Disconnected |
| Name | The port's name, for example Ghn2 |
| Speed | Negotiated speed and duplex |
| PVID | Native VLAN |
| Tagged VLANs, Untagged VLANs | VLAN membership |
| PoE | PoE mode |
| PoE Load | Watts drawn, and allocated where known |
| Connected | How many devices are on the port. Click it to open the connected device's panel. |
| Device MAC | MAC address learned on the port |
| Operation | Switching, Uplink, Aggregating, or Disabled |
| DHCP Trust | Trusted or Untrusted |
| LLDP Rx/Tx | Rx + Tx, Rx only, Tx only, or Off |
| Activity, Tx, Rx | Recent traffic |
| Anomaly | How far the port is from full health, based on problems such as link flapping |
Click a row to open that port's settings. Each row also has a menu of port actions.
#Export the table
Click Export matching CSV to download the ports that match your filters and search. Each row records when it was captured and whether it's a Live snapshot or a Historical snapshot from Time Machine.
#Configure ports
You can change one port or several together.
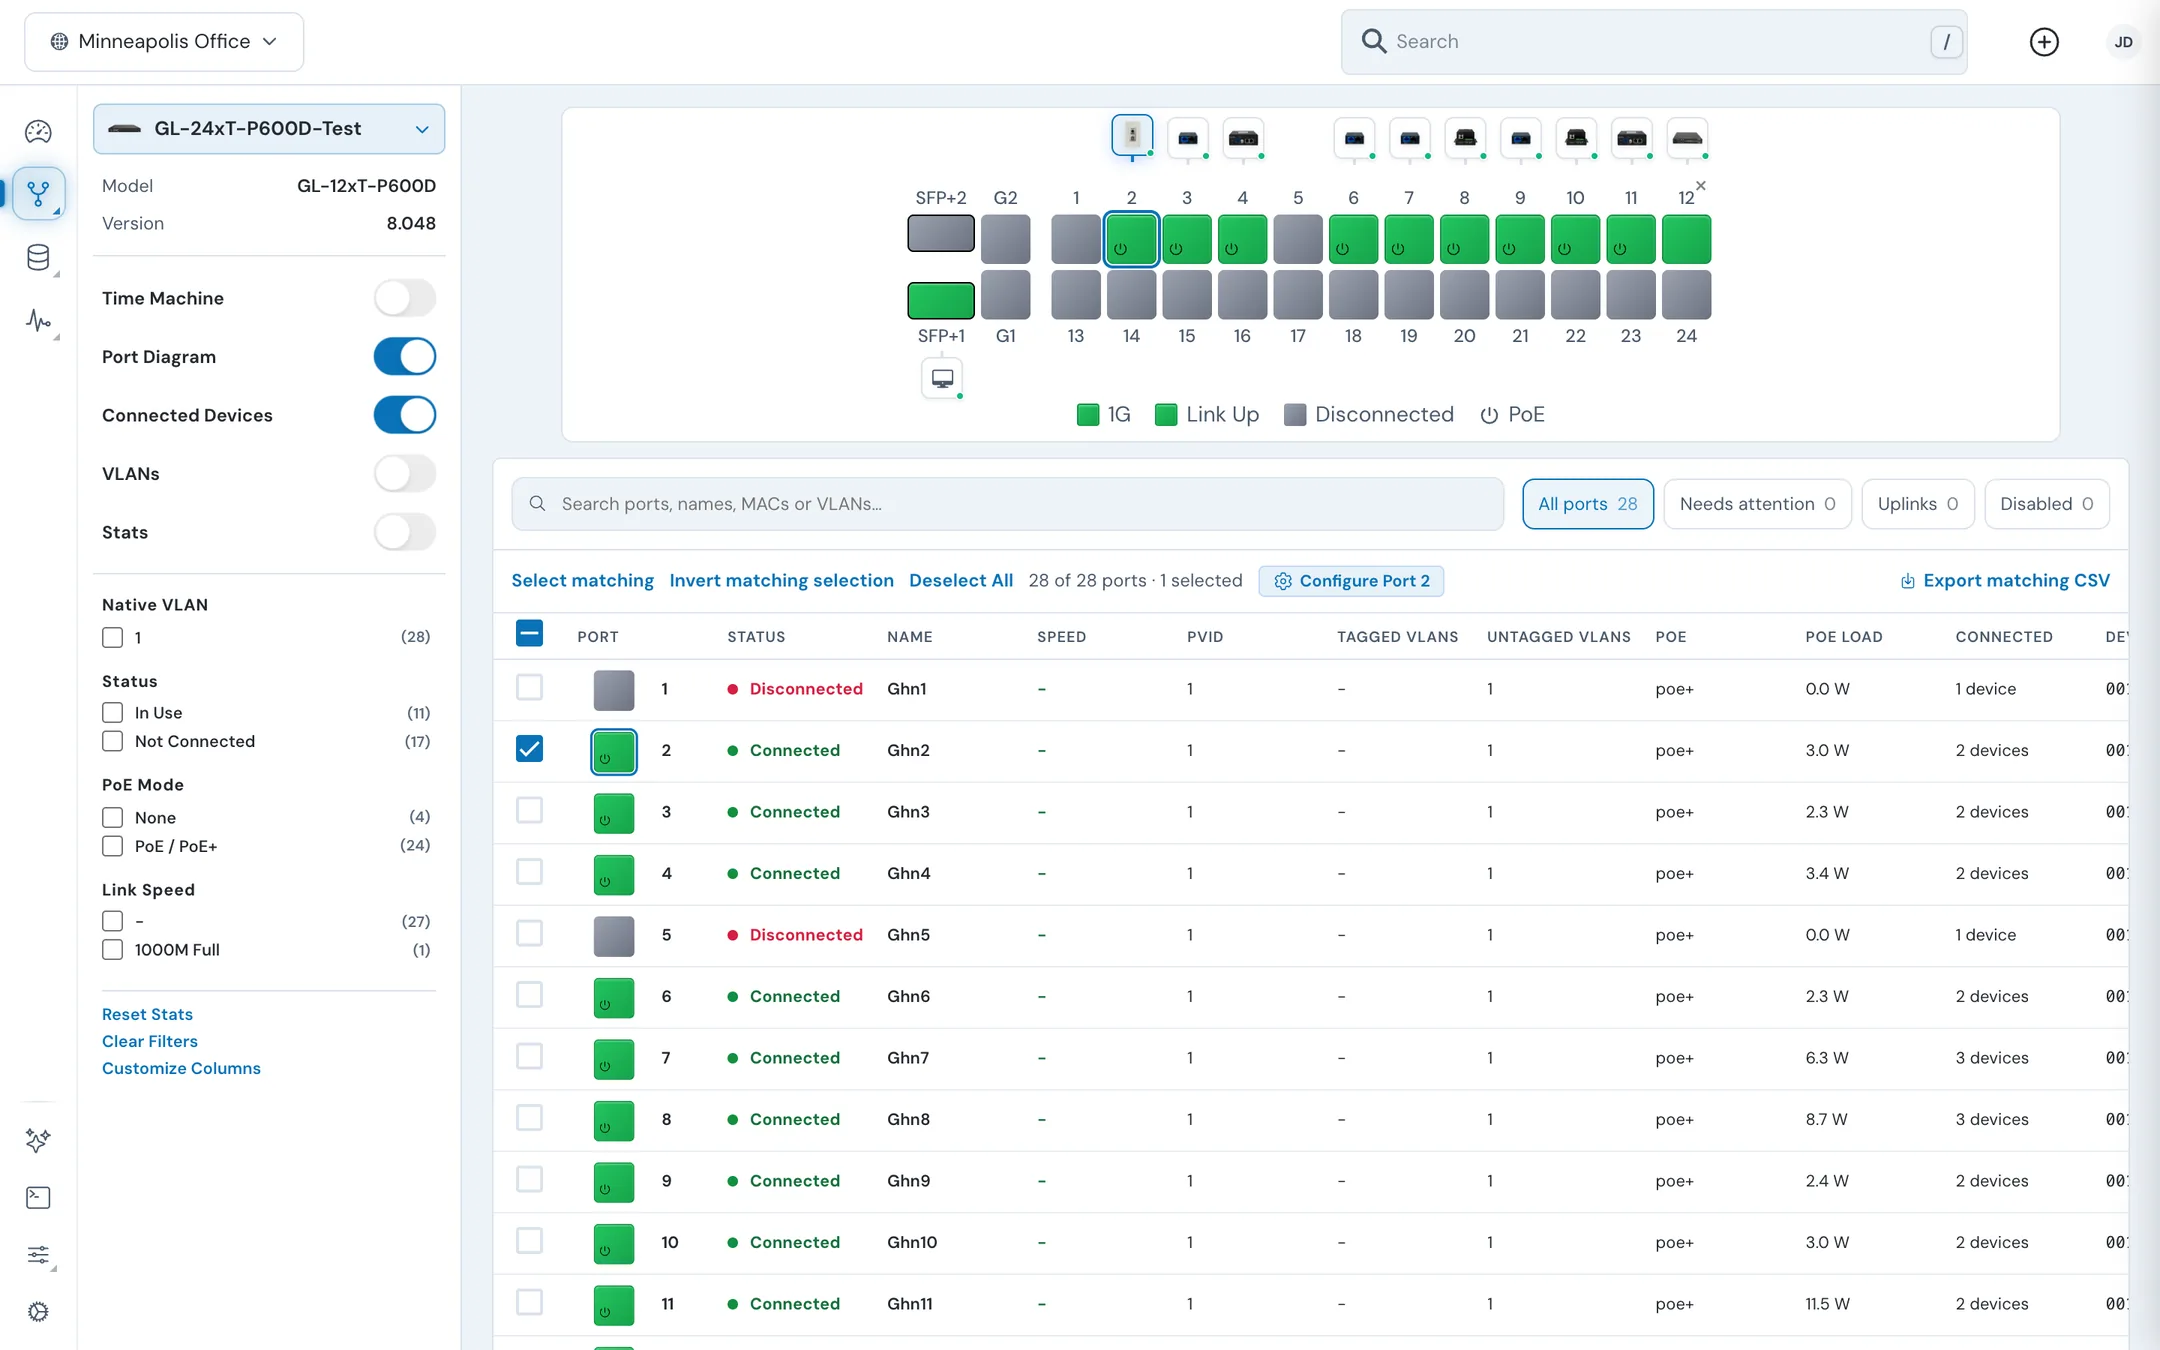
- Select ports: tick their checkboxes, or filter the table and click Select matching. Invert matching selection swaps the selection; Deselect All clears it.
- Click Configure Port N (one port) or Configure N Ports (several). Clicking a row does the same for that port.
- The device's panel opens on its Settings tab with the port settings. Several selected ports are configured together.
- Change the fields you need and click Apply Changes.
You can also select ports on a device's Overview tab and click Configure.
#Port settings
Sections appear only when the device supports them. Hover a field's info icon for its full description.
| Section | Fields |
|---|---|
| Identity | Port Name and Description, each up to 32 characters |
| Port | State: a disabled port passes no traffic. |
| Virtual Local Area Network | VLAN Type (Access, Trunk, or Hybrid), Tagged VLANs, Untagged VLANs, PVID (native VLAN), Forbidden VLANs, Ingress Filter, Frame Type. Enter VLANs as comma-separated IDs, for example 10,20,30. The PVID must be one of the untagged VLANs. |
| Advanced | PoE / PoX (Auto, Force, or Off), Mode, MTU (standard Ethernet is 1500; jumbo frames up to 9216), Aggregation Group, Flow Control |
| Security | Isolation, DHCP Trust, ARP Trust, Max Mac Learn, DHCP Rate Limit, and the DHCP and IPv6 DHCP snooping options |
| Loop Protection | Loop Detection Admin watches for loops; Loop Detection Control turns the port off if a loop is found |
| Data | Negotiation (Auto or Force), Speed Duplex Configuration, Upload Rate Limit (traffic received from the client), Download Rate Limit (traffic sent to the client) |
| Link Layer Discovery Protocol | Enabled, RX, TX |
| Rapid Spanning Tree | RSTP: the port takes part in spanning tree and is blocked if it would create a loop |
| Multiple Spanning Tree | MST instances, when the switch runs MSTP |
| LED Control | LED Enable and LED Color |
| Actions | Cycle shuts the port down and brings it back up after a few seconds. ReadyLink ports also have Reboot (a soft reboot of the port) and Reset (a hardware reset). |
For what each setting does on the switch, see Switchport settings.
#Read port statistics
Turn on Stats to show traffic charts above the table. Pick 1D, 7D, or 1M in the left panel.
The tabs are Total, By Port, Usage, PoE Mode, Packets, Broadcast, Multicast, Errors, Link, and System Resources. Show rates in bps or totals in bytes, and All, Download, or Upload.
The charts add up the ports you've selected ("Aggregate of N ports"). With nothing selected, click Select All to chart every port.
#Look back with Time Machine
Time Machine shows the device's ports as they were at an earlier moment in the last 24 hours.
- Turn on Time Machine in the left panel. A timeline opens beside the page. Its header counts the events in the last 24 hours, and markers along it show events such as a ReadyLink client connecting to or disconnecting from a port.
- Drag the timeline or scroll over it to move back in time, or click an event marker to jump to it. The cursor label changes from LIVE to the time you're viewing.
- The port diagram and table now show the ports at that time.
- Click Back to live to return to the current state.
At a past moment, these come from the port history:
- Link up or down, enabled or disabled, and uplink
- Speed and duplex, and the PVID
- The MAC addresses seen on each port, and the ReadyLink clients on each ReadyLink port
- Spanning tree state and role
- PoE mode and whether the port was powering a device
- Link flapping, shown in Anomaly
Names, descriptions, tagged and untagged VLAN membership, and LLDP always show the current values. Traffic columns (Activity, Tx, Rx) are blank in the past, because they're live counters. If history can't be loaded, the timeline says Port history unavailable.
The site's Topology page has its own Time Machine for the whole network.
#Related guides
Last updated November 10, 2026