Events, logs, and alerts
Read a site's event history, work through grouped incidents across your organization, and choose which alerts are sent by email or webhook.
ReadyView records what happens on your networks as events: devices going offline, configuration changes, template pushes, client disconnects, and more. This page covers where to read those events, how the incident inbox groups them so you can deal with the worst problems first, and how to choose which alerts reach you.
#Where to find events
| Page | Where | What it shows |
|---|---|---|
| Events | Inside a site, Operations > Events in the left rail | Every event for that site, newest first |
| View Logs | Administration > View Logs, or the Operational Incident Center icon in the top bar | Events from every site in your organization, grouped into incidents, plus the raw log |
| Notifications | Notifications in the left rail at organization level | Which alerts are sent, and where they go |
#Site events
The Events page lists every event recorded for the site you're in. New events appear without reloading the page.
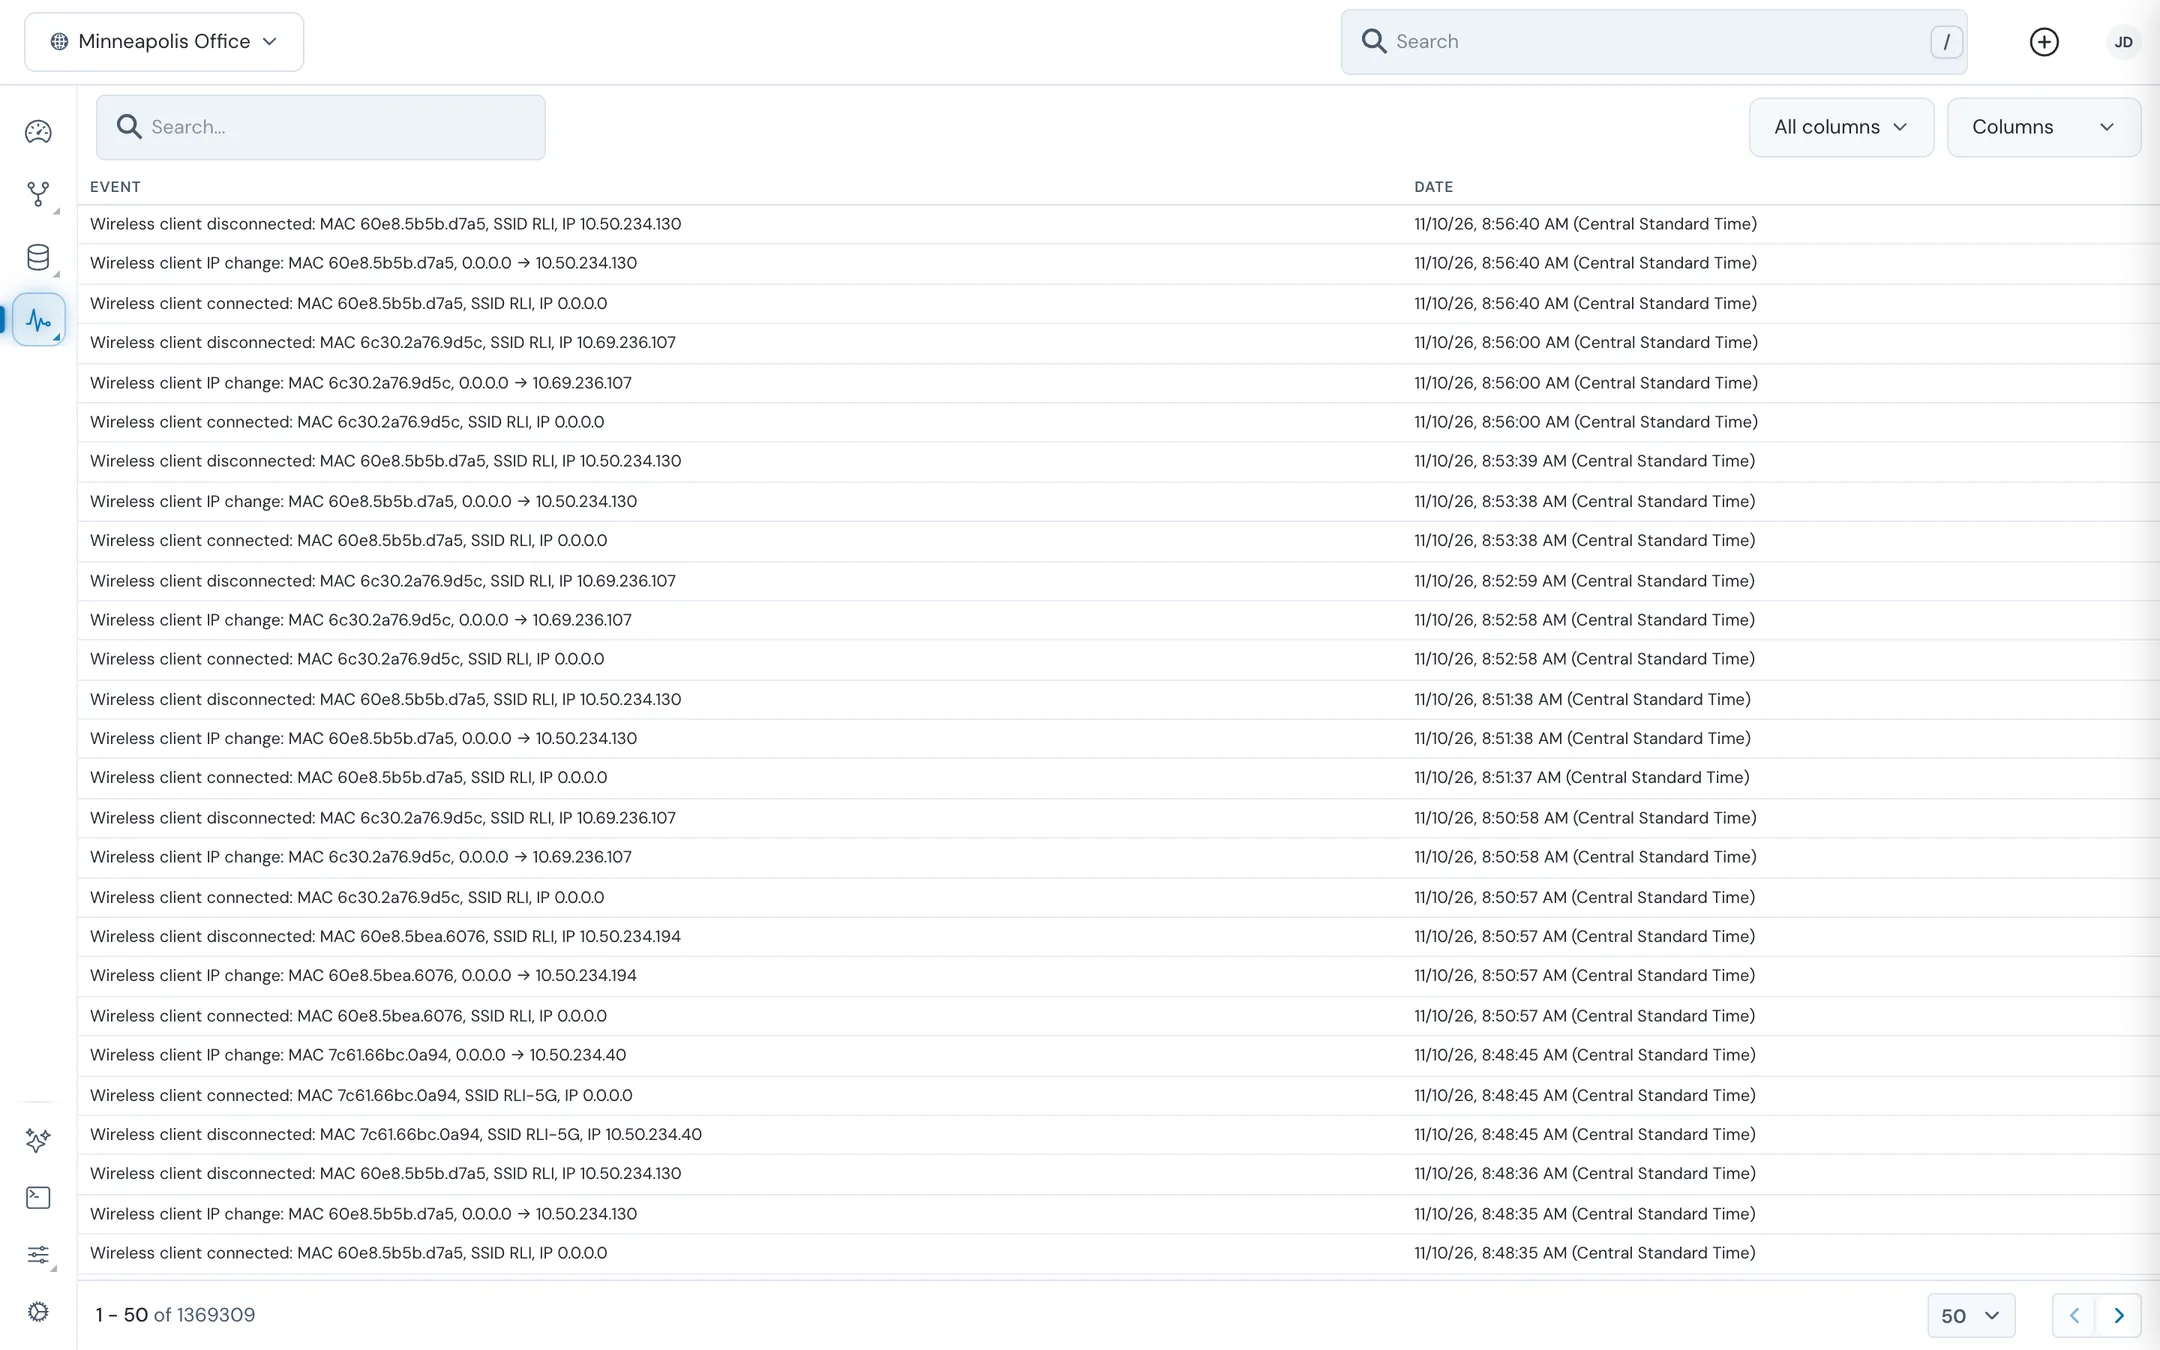
| Column | What it shows |
|---|---|
| Event | The event message, for example a device going offline or a template being applied |
| Date | When the event happened, with the time zone shown in brackets |
#Find an event
- Type in the Search... box. The list narrows as you type.
- To search one column only, change All columns to that column.
- To show or hide columns, click Columns.
- Use the page-size menu and the arrows at the bottom of the table to move through the list.
#Open an event
Click an event to open Event Details. It shows:
- The message, the time it happened, and a longer description when there is one.
- For a configuration template push, what the device did with each setting: Refused by the device, Steps the device never answered, Not acknowledged by the device, and Already on the device, each with a count.
- The Event ID.
- Device Information for the device involved: MAC Address, Model, Status, Firmware, and Location. Click the MAC address to open the device.
- Network Information for the site: Network Name, Alarmed, ReadyOn, and Address.
- The Clients connected to the device.
Click Acknowledge to mark that you've seen the event. The button then reads Acknowledged.
#Incidents across your organization
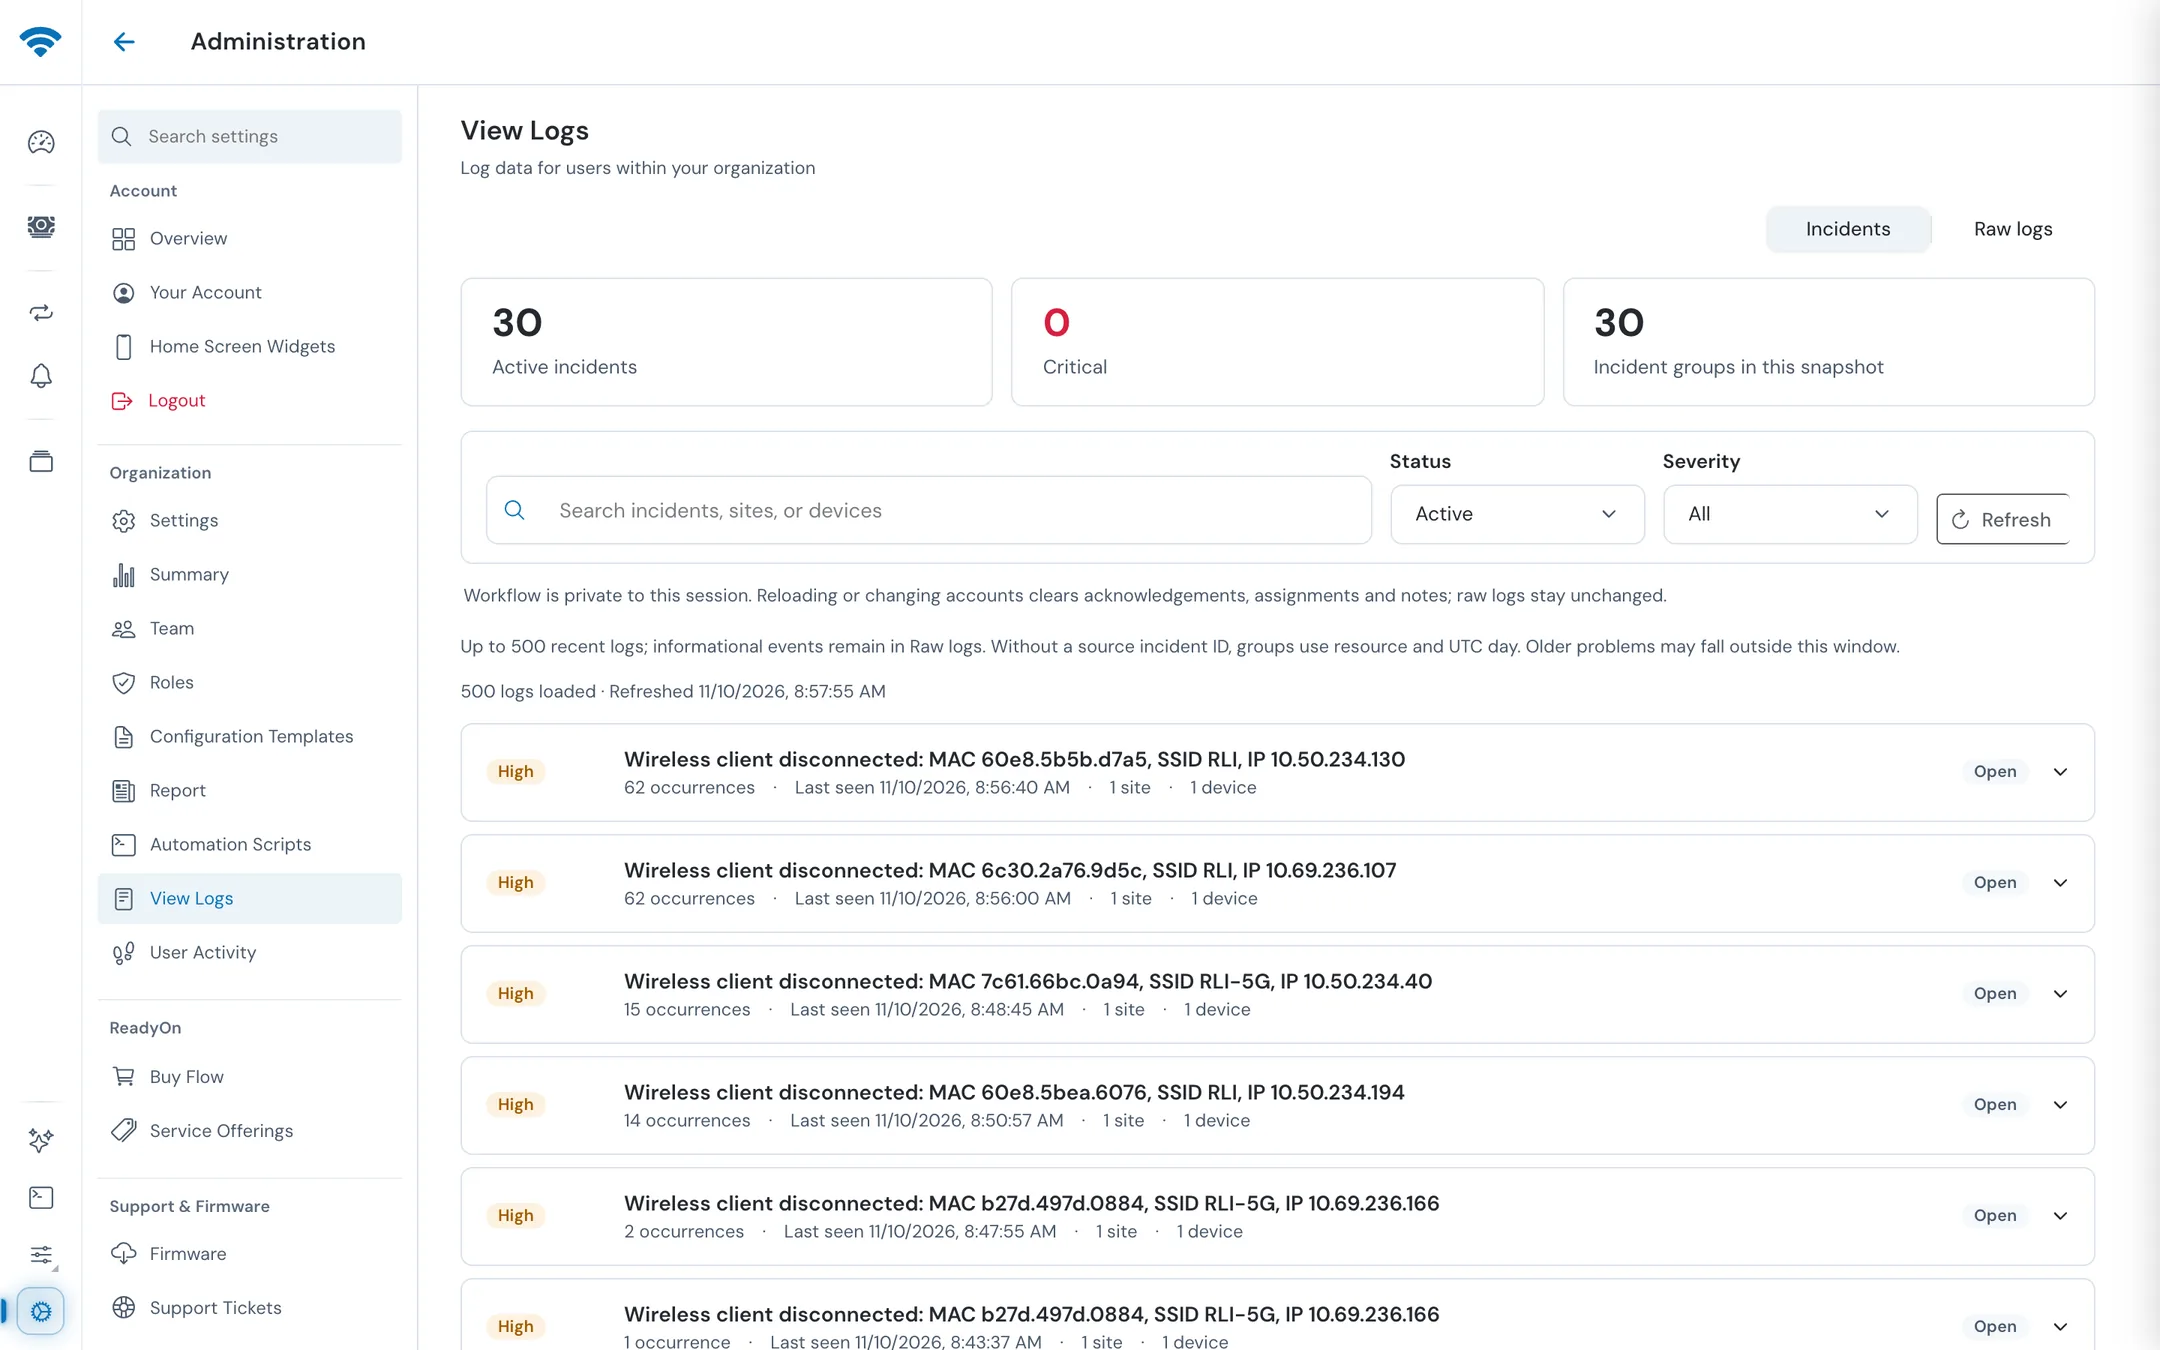
View Logs collects events from every site you can see. Open it from Administration > View Logs, or click the Operational Incident Center icon in the top bar. The page has two views, Incidents and Raw logs. Switch between them at the top right.
#The Incidents view
Repeated events are grouped into one incident, so a device that drops off fifty times shows up once with a count instead of fifty times.
- The tiles at the top count Active incidents, Critical incidents, and Incident groups in this snapshot.
- Search with Search incidents, sites, or devices.
- Filter with Status (Active, All, Open, Acknowledged, Resolved; Active is the default) and Severity (All, Critical, High, Medium).
- Click Refresh to load the latest events. The line under the filters shows how many logs were loaded and when.
Each incident shows its severity, its message, the number of occurrences, when it was last seen, how many sites, devices, and clients it affects, and its status (Open, Acknowledged, or Resolved).
#How incidents are grouped and ranked
Events are grouped by event type and message, by the device or other resource involved, and by day (UTC). When an event carries no severity of its own, ReadyView sets one from the words in its message:
| Severity | Words in the message |
|---|---|
| Critical | outage, unreachable, down, fatal, critical |
| High | failed, failure, offline, error, disconnected, timed out |
| Medium | warning, degraded, retry, refused, unanswered, unstable |
Events below Medium don't become incidents; you can still find them in Raw logs. The list is sorted by severity first, then by how many sites, clients, and devices are affected, then by how often the event repeated, how long it has gone on, and how recent it is.
#Work an incident
- Click an incident to expand it. You see the Affected sites, Affected devices, and Affected clients (each one links to its page), and the First recorded event and Last recorded event.
- Click Acknowledge to show you're on it, or Assign to me to take it. Click the × next to your name to unassign.
- Click Open diagnostic to open the event details of the latest event, or Download diagnostics for a PDF summary of the incident.
- Click Explain with ReadyAgent to ask the AI assistant about the incident.
- Type in Add investigation notes and click Add note to keep notes on the incident (up to 500 characters each).
- When the problem is fixed, click Resolve. If new events for the same problem arrive later, the incident reopens. You can also reopen it yourself with Reopen.
The Raw log timeline at the bottom of an expanded incident lists the individual events. Click one to open its event details.
#Raw logs
The Raw logs view lists the original events unchanged, in a table with Log Message and Time Stamp columns. An ID column is available from Columns. Click a row to open Event Details.
#Alert notifications
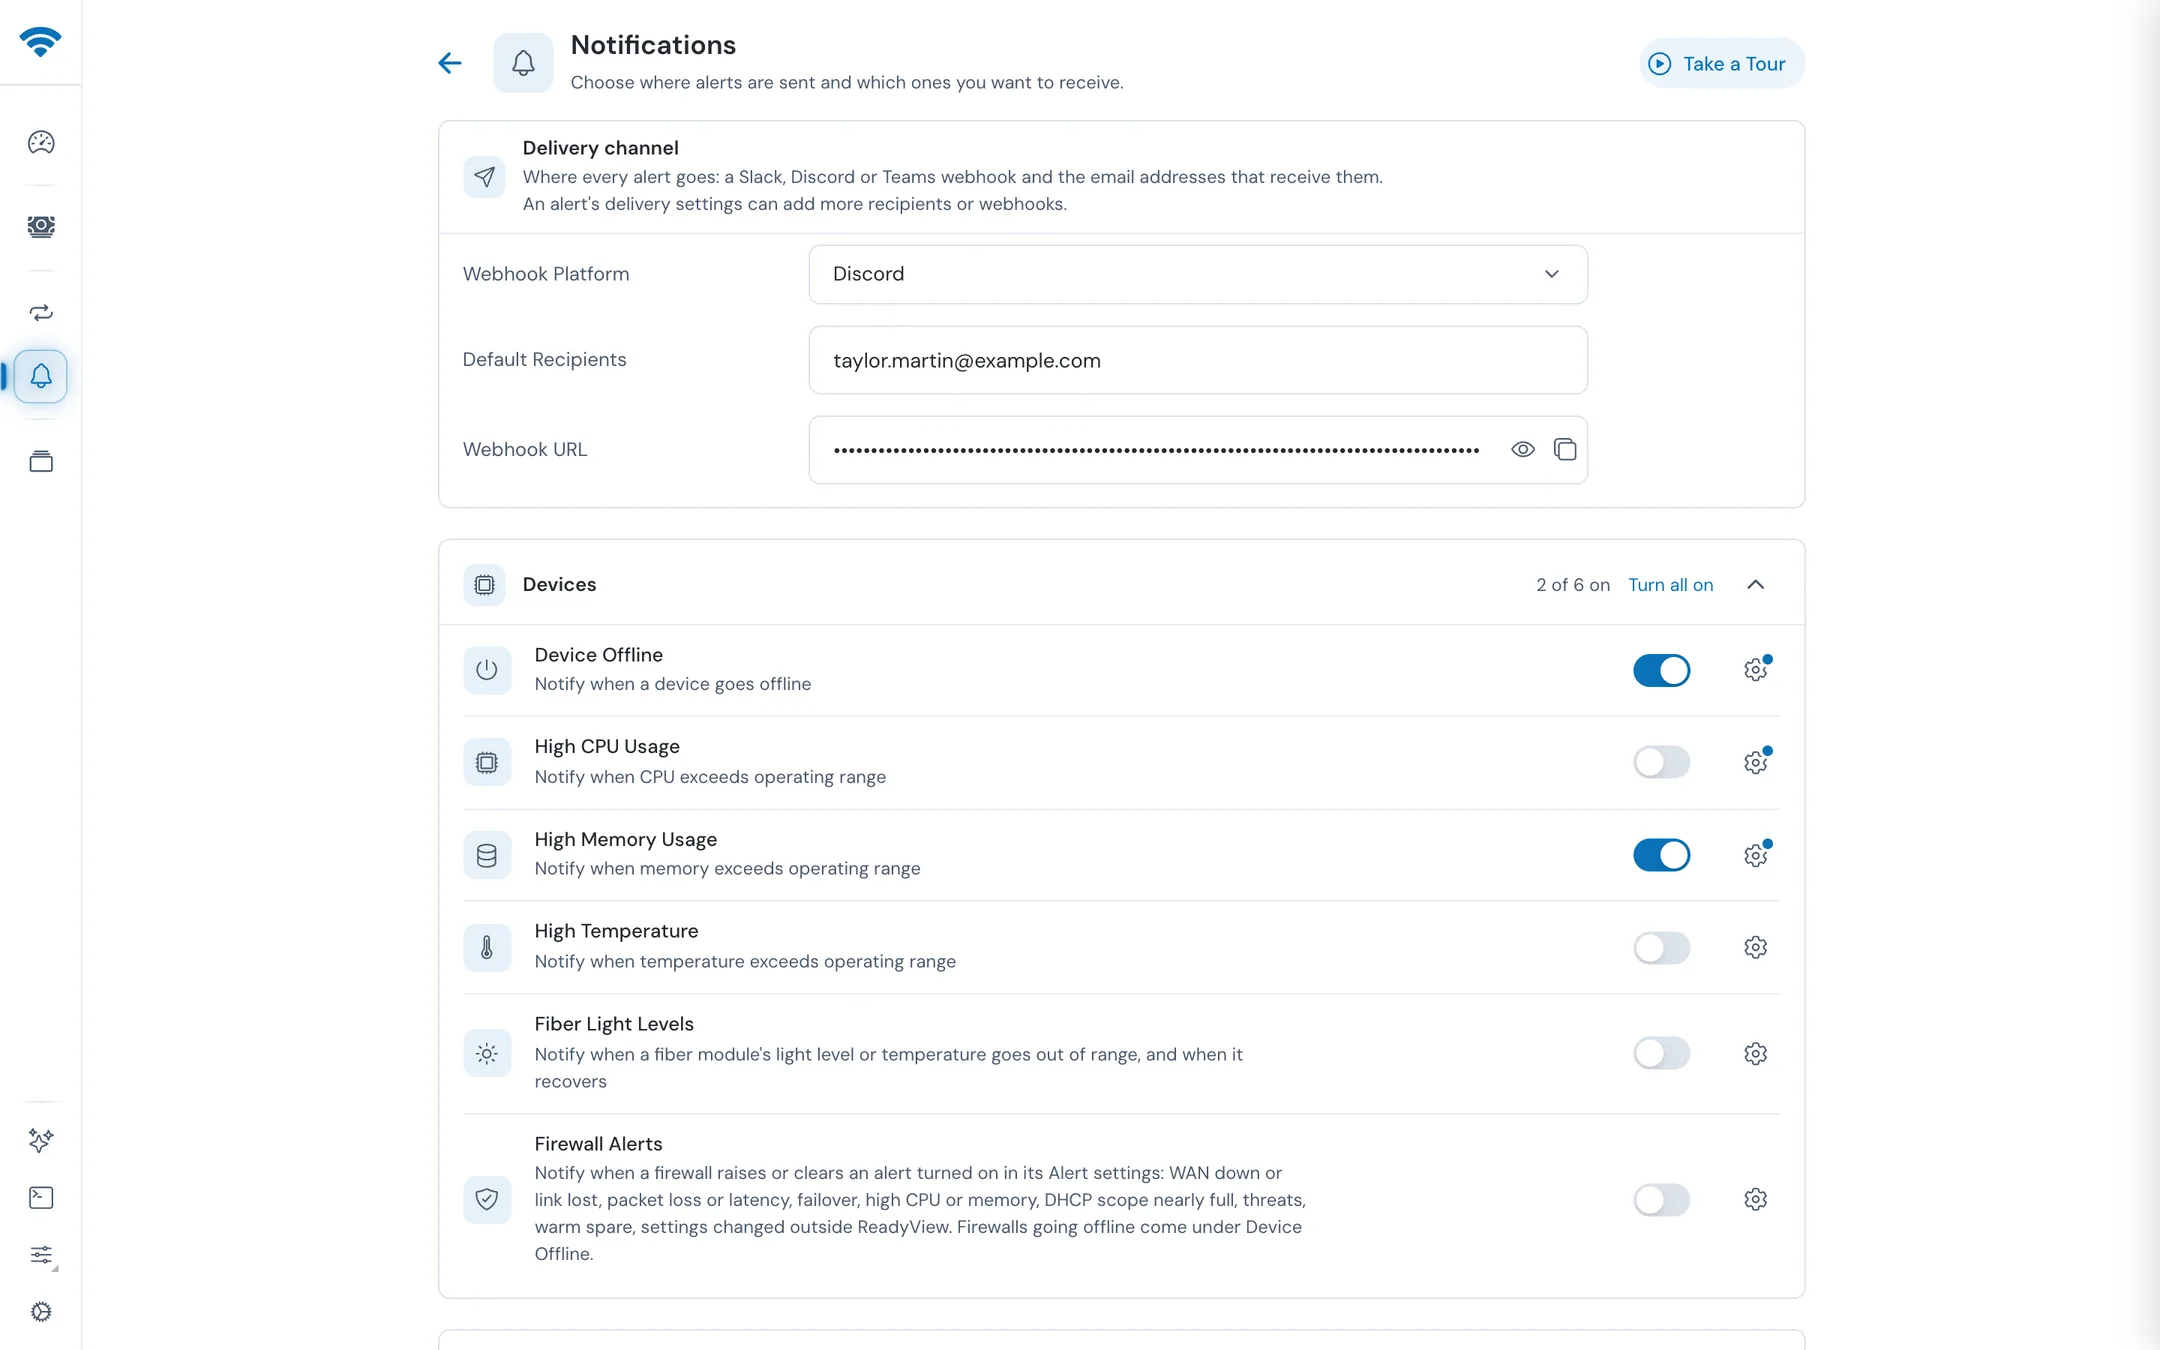
The Notifications page sets where alerts are sent and which alerts you want. Open it from Notifications in the left rail. Click Take a Tour for a guided walkthrough.
#Set where alerts go
The Delivery channel card applies to every alert.
- Choose a Webhook Platform: Slack, Discord, or Teams.
- In Default Recipients, enter the email addresses that should receive alerts, separated by commas, for example
[email protected], [email protected]. - Paste the Webhook URL from your chat platform. The URL must match the platform you chose: a Slack incoming webhook (
hooks.slack.com/services/...), a Discord webhook (discord.com/api/webhooks/...), or a Teams webhook (...webhook.office.com/webhookb2/...). Otherwise you see an "Invalid ... webhook URL(s)" error. - Click Apply Changes, then Save.
The webhook URL is hidden after it's saved. Use Show webhook URL to see it or Copy webhook URL to copy it.
#Choose which alerts you get
Alerts are grouped by what they're about. Each alert has its own toggle. Each group shows how many of its alerts are on and has a Turn all on or Turn all off button.
| Group | Alert | Sent when |
|---|---|---|
| Devices | Device Offline | A device goes offline |
| High CPU Usage | A device's CPU goes outside its operating range | |
| High Memory Usage | A device's memory goes outside its operating range | |
| High Temperature | A device's temperature goes outside its operating range | |
| Fiber Light Levels | A fiber module's light level or temperature goes out of range, and again when it recovers | |
| Firewall Alerts | A ReadyWall firewall raises or clears an alert that's turned on in its own alert settings. Firewalls going offline come under Device Offline. See Firewalls | |
| Clients | Client Disconnect | A client disconnects |
| Subscriptions | New Subscription | A ReadyOn subscription is created |
| Subscription Cancelled | A ReadyOn subscription is cancelled | |
| Reports | Weekly Health Report | Weekly, with a summary of network performance and health details for each device |
Turn on the alerts you want, then click Apply Changes and Save.
#Send one alert to extra people
- Click the gear button next to the alert.
- Add Recipients (extra email addresses) or Webhook URL's (extra webhooks) for this alert only.
- Click Apply Changes, then Save.
These are sent in addition to the default recipients and webhook. A dot on the gear button means the alert has its own recipients or webhooks.
#Turn alerts on for a site
Each site has its own switch for offline and fiber light-level alerts. In the site, open Settings > General and turn on Email alerts in the Notifications & support card. It sends email and webhook alerts when devices in that site go offline or a fiber light level goes out of range. See Site settings.
#Related guides
Site settings
Turn on email alerts for a site, and manage its networks, Wi‑Fi, and access.
Troubleshooting
What to check when a device is offline or a change doesn't apply.
Assistant and automation
Ask ReadyAgent to explain an incident, and run routines and scripts.
Roles and permissions
Control who can change alert settings.
Last updated November 10, 2026