Site dashboard
Read a site's dashboard to see its devices, its internet connection, firewall traffic, and network health in one place.
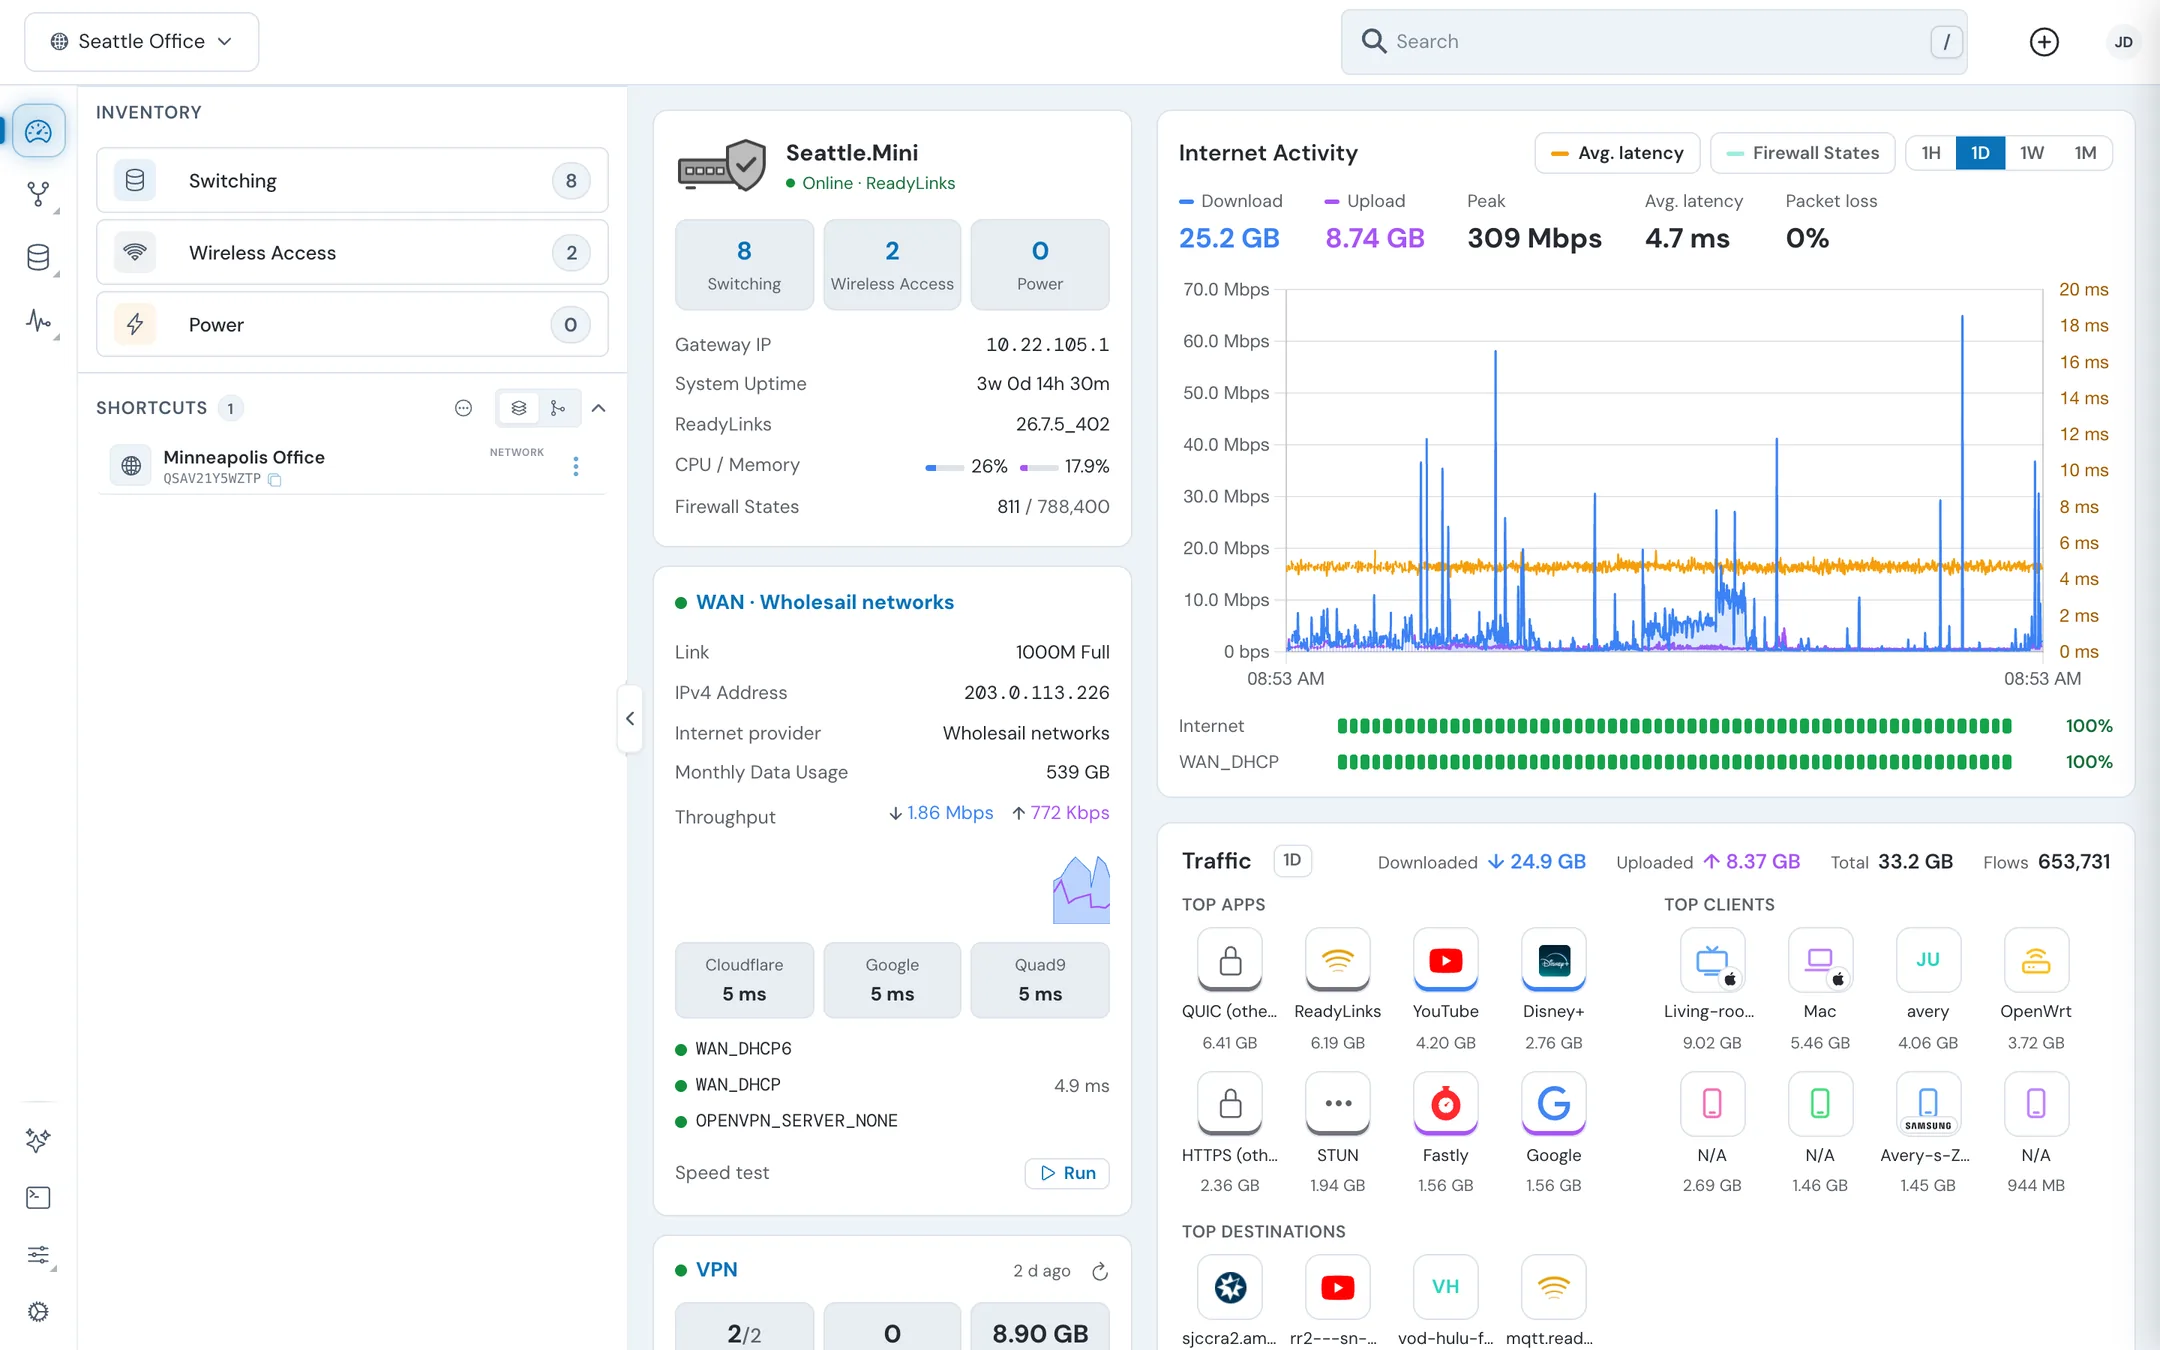
The site dashboard is the first page you see when you open a site. It shows what's installed at the site, how its internet connection is doing, and how the network is performing. If the site has a ReadyWall firewall, the dashboard also shows its WAN links, VPNs, and traffic.
Open it by clicking a site's card on the organization Dashboard, or by clicking Dashboard, the first icon in a site's left rail.
#Inventory and shortcuts
The panel on the left side of the dashboard has two sections.
Inventory counts the site's devices by kind. Click a row to open that device list:
| Row | Opens |
|---|---|
| Switching | Switches, the site's switch list. |
| Wireless Access | Wireless, the site's access points. |
| Power | Power Management, the site's power devices. |
See Devices for each list.
Shortcuts holds the sites, devices, and ports you've pinned. It's the same list as on the organization Dashboard. See Keep shortcuts.
#Firewall section
The firewall cards appear only when the site has a ReadyWall firewall. With more than one firewall, each gets its own card. This page covers what the cards show. To manage the firewall itself, see Firewalls.
#Gateway
The top of the firewall card shows the firewall's name and status, and the Switching, Wireless Access, and Power counts for the site. Below them:
| Field | Shows |
|---|---|
| Gateway IP | The firewall's LAN gateway address. |
| System Uptime | How long the firewall has been running since it last started. |
| Software name (for example OPNsense) | The version of the firewall's software. |
| CPU / Memory | Current processor and memory use. |
| Firewall States | Connections the firewall is tracking now, out of its maximum. |
#WAN
Each WAN link gets its own panel, titled with its internet provider when ReadyView knows it.
| Field | Shows |
|---|---|
| Link | The link's speed and duplex. |
| IPv4 Address | The WAN's IPv4 address. A Private tag means the address isn't public: the firewall sits behind another router or carrier-grade NAT. |
| IPv6 Address | The WAN's IPv6 address, when it has one. |
| Public IP | The public address the site reaches the internet from, shown when the WAN's own address is private. |
| Internet provider | The provider for this WAN. |
| Monthly Data Usage | The firewall's WAN download and upload for the month. It shows on the first WAN panel. |
| Throughput | Live download and upload, with a chart of the last minute. |
Below these, the panel shows the latency from the firewall to Cloudflare, Google, and Quad9, then each gateway with its latency and any packet loss.
To test the link, click Run under Speed test. The firewall runs the test from that WAN and the result appears in the panel.
#VPN
The VPN card shows the firewall's remote-access and site-to-site VPNs:
- Tunnels up, Remote users, and Transferred totals;
- one row per VPN, with its type and state;
- Connected now, listing remote users who are connected, or No one is connected.
The card shows when ReadyView last read the VPNs. Click the refresh button (Read the VPNs from the firewall now) to read them again. Click Manage to open the firewall's VPN settings. If the firewall has no VPN, the card says No VPN is set up on this firewall. and offers Set up. See Guest access and VPN.
#Internet Activity
The Internet Activity chart plots the site's internet download and upload over time.
- Choose the time range: 1H, 1D, 1W, or 1M. The Traffic and Gateway latency and packet loss sections below follow this range.
- Click Avg. latency or Firewall States to lay that line over the chart.
- The totals above the chart show Download, Upload, Peak, Avg. latency, and Packet loss for the range.
- The bars below the chart show uptime for the site's internet connection overall and for each WAN, as a percentage.
#Traffic
Traffic breaks down what the site's users did over the chart's range. It starts with Downloaded, Uploaded, Total, and Flows, then:
| List | Shows |
|---|---|
| Top Apps | The applications that moved the most data. |
| Top Clients | The devices that moved the most data, with their MAC address and their top apps. |
| Top Destinations | The sites on the internet that moved the most data. |
| Applications | Traffic by category, with Category, Down, Up, and Share. |
| Networks | Traffic by LAN network, with Network, VLAN, Clients, and Total. |
Each item in the top lists shows its download, upload, share of the total, and number of flows.
#Gateway latency and packet loss
This section shows the average and maximum latency, and the packet loss, for each gateway and for each probe (Cloudflare, Google, Quad9) over the chart's range.
#Interfaces
The Interfaces table lists the firewall's interfaces with their Link, IPv4 Address, IPv6 Address, and Utilization.
#Network Analytics
Network Analytics covers the whole site, with or without a firewall. Choose its range at the top: 1D, 1W, or 1M. Most cards have a button to collapse them.
| Card | Shows |
|---|---|
| Charts | Up to four charts at once. Click Choose charts to pick from Network Throughput, Connected Devices, PoE Power, Switch CPU, and Switch Temperature. |
| Infrastructure Health | A health score for the site's devices, with Issues Detected when any are offline, and Total Devices with how many are online and offline. |
| PoE Power Budget | PoE power drawn against the switches' total budget (or Power budget not reported), with Allocated power, Active PoE Ports, and Reporting switches. |
| Top Bandwidth Talkers | The ports that moved the most traffic. |
| Busiest Access Points | The access points with the most clients. |
| Alarms | Active alarms, grouped by type. Click Show all for the full list, or What ReadyView watches for for the alarm types. |
| Offline Devices & Risk | Devices that are offline, with their model, MAC address, and how long ago they were last seen. |
| Network Diagnostics Hub | Quick tools. MAC vendor names the maker of a MAC address you paste in. Subnet is a subnet calculator: enter an address and prefix such as 10.0.0.0/24. |
| Active Channels | Every Wi-Fi channel on each band (2.4, 5, and 6 GHz), with the ones in use highlighted. The legend marks channels as Active, Inactive, Shared or busy, or DFS. |
| AP Signal Density | The average client signal (RSSI) per access point, from -90 dBm (weak) to -30 dBm (strong). |
The Alarms card notes that "Port checks such as loops, G.hn links and port errors show in each device's panel." Here "G.hn links" means ReadyLink connections. Those checks appear on the device's own page. See Events and alerts.
#Change the cards
The buttons at the top right of Network Analytics change the section:
- Customize lets you choose which cards show and where.
- Change this dashboard with the assistant opens the AI Assistant to make the change for you. See Assistant and automation.
- Take a Tour walks you through the cards.
#Open the details
The dashboard links into the rest of the site:
| Click | To open |
|---|---|
| An Inventory row, or a count on the firewall card | That device list. |
| A device in Offline Devices & Risk | That device's panel. See Switch, access point, and client details. |
| An alarm in Alarms | The device the alarm is about. |
| Manage on the VPN card | The firewall's VPN settings. |
To open the firewall, choose Devices > Firewalls in the site's rail.
#A site with no devices
A site without devices shows No Devices Connected. Click Add Devices to claim your first device. See Adding devices.
#Related guides
Last updated November 10, 2026